

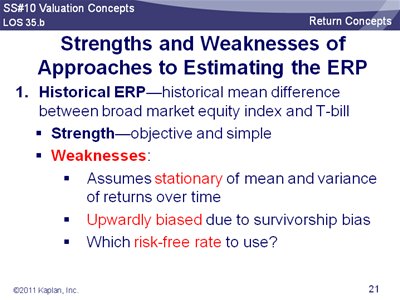
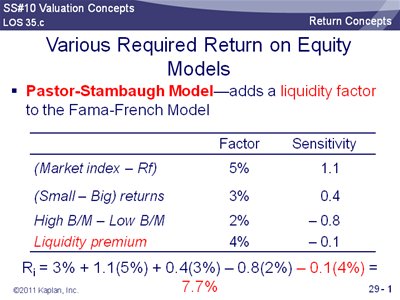
Required Rate of Return on Equity by estimating Equity Risk Premium (ERP)


VALUATION MODELS
Justified PE

Justified P/S= P/E *E/S

NOPAT
In corporate finance, net operating profit after tax (NOPAT) is a company's after-tax operating profit for all investors, including shareholders and debt holders.[1] NOPAT is used by analysts and investors as a precise and accurate measurement of profitability to compare a company's financial results across its history and against competitors. [2]
When calculating NOPAT, one removes Interest Expense and the effects of other non-operating activites (non-recurring gains and losses) from Net Income to arrive at a value that approximates the value of a firm's annual earnings. NOPAT is precisely calculated as:
When calculating NOPAT, one removes Interest Expense and the effects of other non-operating activites (non-recurring gains and losses) from Net Income to arrive at a value that approximates the value of a firm's annual earnings. NOPAT is precisely calculated as:
NOPAT = (Net Income - after-tax Non-operating Gains + after-tax Non-operating Losses + after-tax Interest Expense
NOPAT doesn’t include one-time losses and other non-recurring charges because they don’t represent the true, on-going profitability of the business. [2] For example, a company may incur acquisition costs that would not be expected to occur in the future. These costs would negatively effect current year earnings, but do not accurately portray the operations of the firm. costs should be excluding when performing any type of analysis to determine the operating and financial efficiency of a firm or to compare performance against other firms.
NOPAT doesn’t include one-time losses and other non-recurring charges because they don’t represent the true, on-going profitability of the business. [2] For example, a company may incur acquisition costs that would not be expected to occur in the future. These costs would negatively effect current year earnings, but do not accurately portray the operations of the firm. costs should be excluding when performing any type of analysis to determine the operating and financial efficiency of a firm or to compare performance against other firms.
For a rough calculation, NOPAT approximates earnings before interest after taxes (EBIAT).[3]
The rough calculation for NOPAT is:
- NOPAT = Operating profit x (1 - Tax Rate)
NOPAT is frequently used in calculations of Economic value added and Free cash flow.
Free Cash Flow
In corporate finance, free cash flow (FCF) is cash flow available for distribution among all the securities holders of a corporate entity. They include equity holders, debt holders, preferred stock holders, convertible security holders, and so on.
|
|
|
|
|
|
|
|
|
|


Residual income approach to Valuation
Residual Income takes a step more than accounting income as it considers charge on equity
Compared with Freecashflow approach, FCF is a step backward to accounting income as it adds back charge on Debt (and add back non cash items and deducts capital expenses required to operate at current level)
Residual income is net income less a charge for common shareholders' opportunity cost in generating net income. Unlike accounting income, residual income recognizes the cost of equity capital in the measurement of income. It attempts to measure economic profit: profits after accounting for all opportunity costs of capital.
Net income reported in financial statements includes a charge for the cost of debt capital in the form of interest expense but not the cost of equity capital. Shareholders run opportunity costs by foregoing other potentially profitable investments, having their capital tied up in the company's stock. A company can have positive net income but may still not be adding value for shareholders if it does not earn more than the cost of equity capital.There are two ways to calculate residual income:
- Residual income is calculated as net income minus a deduction for the cost of capital. The deduction is called the equity charge which is the dollar amount of opportunity profits foregone by equity investors. The equity charge is equal to equity capital multiplied by the required rate of return on equity.
- Subtract total capital charge from after-tax operating income. Capital charge equals total assets times weighted average cost of capital (WACC). Since WACC reflects both cost of equity and after-tax cost of debt, multiplying it by total assets gives the total dollar cost of all sources of capital for the company.
The Maisy Grain Company makes gourmet bread products.
- Assets = $100.8 million.
- Debt = $40.2 million.
- Equity = $60.6 million.
- Pretax cost of debt = 7.1%.
- Cost of equity = 13.3%.
- Number of shares outstanding: 20 million.
- Tax rate = 40%.
EBIT: $7,560,000.
Less: interest expense: $2,854,000 ($40.2 million x 7.1%).
Pretax income: $4,706,000.
Less: income tax expense: $1,882,400 (4706000 x 0.4).
Net income: $2,823,600.1) Using the equity charge method, we calculate residual income:
Equity charge = equity capital x cost of equity = 60.6 x 13.3% = $8,059,800.
Residual income = net income - equity charge = 2,823,600 - 8,059,800 = -$5,236,200.2) To use the capital charge method, we need to calculate WACC first.
WACC = Equity share x cost of equity + Debt share x cost of debt x (1 - Tax rate) = ($60.6/$100.8) x 0.133 + ($40.2/$100.8) x 0.071 x (1 - 0.4) = 9.69%.Note that in the calculation of WACC we used after-tax cost of debt, since interest expense is tax-deductible.After-tax operating income = EBIT x (1 - Tax rate) = $7.56 x (1 - 0.4) = $4,536 million.Residual income = After-tax operating income - (Total Assets x WACC) = $4.536 - ($100.8 x 0.0969) = $ (5.23) million.As we can see, the capital charge and equity charge methods lead to the same residual income estimate.Since the residual income is negative, the Maisy Grain Company is not earning enough to compensate its shareholders for the risk. If investors expect this situation to persist indefinitely, the demand of the company's stocks will go down and the stock will fall in price.We can determine the price per share at which the company would be earning the required rate of return. Suppose the company is paying out all its earnings. We know that earnings per share equal net income/shares outstanding = $2,823,600/20,000,000 = $0.14118. The book value per share is 100.8/20 = $5.04. Since the company is paying out all its earnings, its growth is zero and the earnings yield (E/P) equals its required rate of return (remember from Gordon constant growth model that if g=0, and b=1, we have P/E = 1/required rate of return).Therefore, $0.14118/P = 0.133 and P = $1.06. As we see from this example, a company with negative residual income has its shares trading below the book value. At this market price per share, the company's stockholders can earn EPS/P = $0.14118/$1.06 = 0.133 or 13.3% which is equal to the cost of equity.The two approaches will yield different results if the charge for debt capital differs from the interest expense used in net income, or the weights used in calculating the WACC are not based on the book value of the company's debt and equity.
Enterprise Value/EBITDA Ratio
Enterprise Value = Equity(Market Value) + Debt(Market Value)
Life is not so simple. No fun if it is so simple. Now..
EV = Equity(Market Value) + Debt(Market Value) - Cash and Investments
(Since cash and investments does not represent future operational potential)
A formal definition is :Enterprise value (EV) is total company value minus the value of cash and investments.
EV = MV of common stock + MV of preferred stock + MV of debt - cash and investments
To make a PE kind of ratio with EV in place of P, E has to be replaced by EBITDA
Enterprise value / EBITDA ratio
Since EBITDA are distributed between all types of investors in the company (common shareholders, preferred shareholders and creditors), it reflects the fundamental value of the company as a whole. Therefore, a multiple using total company value is logically more appropriate. EV/EBITDA ratio responds to this need.
EV/EBITDA is an indication of company value, not equity value.
Advantages:
- EBITDA is more often positive than net income.
- By adding back depreciation and amortization, EBITDA is invariant to the depreciation method used. EV/EBITDA ratio is often used for valuation of capital-intensive companies.
- It is more appropriate than P/E for comparing companies with different financial leverage, since EBITDA is not influenced by interest expense.
Disadvantages:
- When capital expenditures do not equal the depreciation, EBITDA is not a technically correct proxy to cash flow. This qualification to EBITDA comparisons can be meaningful for the capital-intensive businesses to which EV/EBITDA is often applied.
- EBITDA does not account for changes in the working capital, which makes it even more distinct from the correct cash flow definition.
- EBITDA includes non-cash revenues due to the accrual accounting principle.
Valuation Based on Forecasted Fundamentals
The fundamental drivers of EV/EBITDA are the expected growth rate in free cash flow to the firm and the weighted average cost of capital. The justified EV/EBITDA based on fundamentals bears a positive relationship to the first factor and an inverse relationship to the second.
Valuation Using Comparables
- Firm EV/EBITDA < benchmark: undervalued.
- Firm EV/EBITDA > benchmark: overvalued.
Example
- Net income: 34.0.
- Interest Expense: 7.62.
- Cash outflow for interest payments: 4.0.
- Depreciation and Amortization: 17.2.
- Marginal tax rate: 25%.
- Cash and marketable securities: 8.9.
- Investments: 6.2.
- Price per common share on the Paris Stock Exchange: 13.8.
- Total number of shares issued: 20,000,000.
- Total number shares in treasury stock: 1,320,000.
The company's financials show that the only interest-paying liability assumed by the company is a 5-year $200MM note maturing in 3 years' time and currently trading at 4.13%. The note is paying semiannual coupons and all interest payments have been met so far.
The company also has preferred stock that is not trading on any exchange. The book value of preferred stock is $45. No preferred dividends are currently in arrears.
Solution:
1. Calculation of EBITDA
EBITDA = Net Income + Interest Expense + Depreciation and Amortization + Tax Expense.
Tax Expense = (Net Income / (1 - Tax Rate)) - Net Income = [34.0 / (1 - 0.25)] - 34.0 = 11.3.
EBITDA = 34.0 + 7.62 + 17.2 + 11.3 = 70.12.
Tax Expense = (Net Income / (1 - Tax Rate)) - Net Income = [34.0 / (1 - 0.25)] - 34.0 = 11.3.
EBITDA = 34.0 + 7.62 + 17.2 + 11.3 = 70.12.
2. Calculation of Enterprise Value (EV)
Total market value of common stock = price per share of common stock x number of shares outstanding = Price per share x (shares issued - treasury stock) = 13.8 x (20,000,000 - 1,320,000) = 257.7 MM
Since the company's preferred stock is not publicly traded, we will use its book value for calculation of EV.
Semiannual coupon on the bond = Cash Outflow for Interest Payments / 2 = 4 / 2 = 2.
We know the bond's term to maturity = 3 years.
Yield to maturity = 4.13%.
Semiannual coupon payments = 2MM.
Face Value = 200MM.
Yield to maturity = 4.13%.
Semiannual coupon payments = 2MM.
Face Value = 200MM.
Therefore, we can calculate the bond's total current market value = $188.1.
EV = Total market value of common stock + Total market value of preferred stock + Total market value of debt - Cash balances - Investments = 257.7 + 45.0 + 188.1 - 8.9 - 6.2 = 475.7.
3. Calculation of EV/EBITDA ratio
EV/EBITDA = 475.7 / 70.12 = 6.78
Economic Value Added (EVA)
It is refinement over Residual Income concept
Residual Income = PAT - Capital charge
EVA = NOPAT - Capital Charge
To make PAT as NOPAT , PAT attributable to current operations is arrived.
- R&D expenses instead of hitting P&L fully , they are capitalized and amortized. This increases NOPAT accordingly.
- GoodWill amortization is ignored
- Non-cash tax expense is removed.
- LIFO reserve is added back to the Total Capital and NOPAT is adjusted for the change in LIFO reserve.
- Nonrecurring items are eliminated from the income statement.
Even capital is adjusted to make it attributable to current operations
- capital for strategic investments are suspended if they are not expected to generate a return immediately.
- Operating leases are treated as capital leases.This will increase capital
Treynor Ratio Vs Sharpe Ratio
Treynor ratio shows the risk adjusted performance of the fund. Here the denominator is the beta of the portfolio.
Definition: Treynor ratio shows the risk adjusted performance of the fund. Here the denominator is the beta of the portfolio. Thus, it takes into account the systematic risk of the portfolio.
Description: Jack Treynor extended the work of William Sharpe by formulating treynor ratio. Treynor ratio is similar to Sharpe ratio, but the only difference between the ratios is that of the denominator.
Formula for Treynor ratio: (Rp-Rf)/Beta
where,
Rp: Return on the portfolio
Rf: Risk free rate
B: Beta, the sensitivity of the portfolio to changes in the overall market.
Unlike Sharpe, Treynor uses beta in the denominator instead of the standard deviation. The beta measures only the portfolio's sensitivity to the market movement, while the standard deviation is a measure of the total volatility both upside as well as downside. A fund with a higher Treynor ratio implies that the fund has a better risk adjusted return than that of another fund with a lower Treynor ratio.