Price decreases + volume decreases = Bears don't have strength.
Hero MotoCorp Vs Bajaj Auto: Goldman Sachs’ Pick
: Differences in Firms with in a Industry March 2022
Goldman Sachs initiated coverage on Hero MotoCorp
Ltd. with a ‘sell’, but suggested a ‘buy’ for peer Bajaj Auto Ltd. “We
see the risk reward on Hero as unfavourable given high dependency (94% of
volumes) on domestic two-wheeler market where demand remains subdued,
concentrated portfolio in entry-level sub-110 cc segments where customers are
more vulnerable to the present wave of raw material-led price hikes, and higher
loan losses than peer at captive financing subsidiary,” the financial services
provider said in a March 3 report.
These factors, it said,
drive its 3.1% FY19 to FY25E top line CAGR at Hero MotoCorp versus 8% median
growth for India two-wheeler coverage. “Our FY24E EPS is 20% below consensus.”
“Diversification away from the entry-level segment, an increase in exports
penetration and the nature of response to Hero’s upcoming fixed and swappable
battery electric scooter launches are the key events that we would watch
to see success on in order to turn more optimistic.” On the other hand, Bajaj
Auto’s “meaningful export market exposure in two-wheelers, offsetting ongoing
domestic demand weakness, upcoming cyclical recovery in higher margin
three-wheeler demand, its industry leading dividend yield of 5.4%” prompts
Goldman Sachs to bet on the Pune-based company. “These factors underline
our FY22E-FY25E EPS CAGR of 21%, with FY24E EPS 6% above consensus.” Goldman
Sachs, however, cautioned that the ongoing geopolitical uncertainties,
associated volatility in raw material costs and transition toward electric
two-wheelers could impact margin of the industry.
Hero MotoCorp
Initiates coverage with a ‘sell’ rating and a
price target of Rs 2,080 apiece, indicating a downside of 13.8%. Hero
MotoCorp’s high domestic business mix is sensitive to recent price hikes and
could take longer to start showing revenue growth compared to peers. Witnessed
lowest Ebitda growth and the highest margin compression among its listed mass
market two-wheeler peers (Bajaj Auto and TVS Motor Co. Ltd.) Missed out
on the two key market shifts in the motorcycles segment—exports market
development and premium motorcycles growth. Lost market share in 11 of the past
12 years since split with Honda. Non-performing assets at Hero FinCorp could
weigh on capital allocation flexibility. Slower to market in the
electric scooter space versus Bajaj and TVS, both of which have already
launched their electric scooters and have been competing for more than 12
months.
Bajaj Auto
Initiates coverage with a
‘buy’ and a price target of Rs 4,270 apiece, indicating an upside of 27%.
Benefit of exports market exposure where emission-related price hikes have been
less of a challenge. CNG network expansion by the Indian government to further
support Bajaj’s three-wheeler volumes. Upside optionality from plans to set up
captive financing arm. Expected recovery in domestic three-wheeler
market to benefit Bajaj more than peers. Low exposure to scooters and mopeds
which are more at risk from EV-led disruption.
share turnover velocity(ratio of traded turnover to market capitalisation) If share turnover velocity is an indicator of the breadth of activity and liquidity in the market. Share turnover velocity is the ratio of traded turnover to market capitalisation. Higher the ratio, better the liquidity and more widespread the activity in the market. Globally, investors are attracted to markets with high share turnover velocity as it means lower impact costs (the cost of entering and exiting a stock). In stock markets across the globe, share turnover velocity has been on the rise over the past, one-and-a-half years. In India, the trend has been the opposite, with share turnover velocity declining steadily. Experts attribute factors like concentration of trading in few stocks and high-promoter holding in companies to this trend.
As per World Federation of Exchanges’ data. Share turnover velocity in some of the developed world stock exchanges like Nasdaq, NYSE, Shenzhen Stock Exchange, Taiwan Stock Exchange, BME Spanish, Borsa Italiana, Tokyo Stock Exchange and Deutchse Borse is very high and in many cases runs to over 100%. If there is very low market participation, trading is concentrated to a few players.
5/12/2007 Mutual funds exposure to equity compared to debt is a good indicator of perceived riskiness of market.(But there could be other reasons for changes in ratios)
The equity exposure of Indian mutual funds (MFs) in the secondary market has come down by 37% in FY07 as compared to FY06. The MFs invested Rs 9,062 crore in FY07 as compared to Rs 14,302.20 crore a year earlier. The trend has continued even in the first month of the new financial year. In April 2007, MFs exposure to equity was at Rs 1,022 crore while in April 2006 it stood at Rs 2,850 crore.
MFs' net exposure to debt segment grew 43% in FY07 to Rs 52,543.46 crore from the previous year's Rs 36,801.24 crore.
This sharp rise in MFs' exposure to debt segment in FY07 can be mostly attributed to the fact that fixed maturity plans (FMPs) have gained popularity among the investors during the period. The MFs' exposure to equity in FY06 was higher as during the year, there were large number of equity new fund offerings (NFOs) mobilising resources from the retail investors.
An indicator is anything that can be used to predict future financial or economic trends. For example, the social and economic statistics published by accredited sources such as U.S. government departments are indicators. Popular indicators include unemployment rates, housing starts, inflationary indexes and consumer confidence. Official indicators must meet certain set criteria; there are three categories of indicators, classified according to the types of predictions they make.
New Fund launches data by AMFI
SIZE OF INDIAN STOCK MARKET
Economic Indicators followed by stock market analysts
Lead Indicators - These types of indicators signal future events. Think of how the amber traffic light indicates the coming of the red light. In the world of finance, leading indicators work the same way but are less accurate than the street light. Bond yeilds are thought to be a good leading indicator of the stock market because bond traders anticipate and speculate trends in the economy (even though they aren't always right).
Lag Indicators :A lagging indicator is one that follows an event. Back to our traffic light example: the amber light is a lagging indicator for the green light because amber trails green. The importance of a lagging indicator is its ability to confirm that a pattern is occurring or about to occur. Unemployment is one of the most popular lagging indicators. If the unemployment rate is rising, it indicates that the economy has been doing poorly. Major Indicators followed by stock markets in India are Index of industrial production (IIP) Industrial output figures are released by the Ministry of Statistics and Programme Implementation every month within 40 days from end of month.They are one the important lag indicator
Advance tax numbers
Advance tax numbers 15th June, 15th Sep 15th Dec and 15th march give indication of the upcoming Quarterly results
Auto Sales Numbers
Auto companies release their sales data every month. That allows volatility in auto stocks every month even before quarterly results
US Payroll numbers :
Payroll data impact can be both ways as below :
Stocks climb on Weak Jobs Data
Surprisingly weak jobs data eased fears about higher inflation and a stimulus cutback. The dollar slumped toward the lowest since February and stocks climbed.
Moving Averages
Moving averages allow traders the ability to quantify trends and act as signals for entries, exits, and trailing stops. They can become support and resistance, and give the trader levels to trade around. Below are examples of the specific moving averages with time frames.
5 Day EMA: Measures the short term time frame. This is support in the strongest up trends. This line can only be used in low volatility trends.
10 day EMA: “The 10 day exponential moving average (EMA) is my favorite indicator to determine the major trend. I call this ‘red light, green light’ because it is imperative in trading to remain on the correct side of a moving average to give yourself the best probability of success. When you are trading above the 10 day, you have the green light, and you should be thinking buy. Conversely, trading below the average is a red light. The market is in a negative mode, and you should be thinking sell.” – Marty Schwartz
21 day EMA: This is the intermediate term moving average. It is generally the last line of support in a volatile up trend.
50 day SMA: This is the line that strong leading stocks typically pull back to. This is usually the support level for strong up trends. Use 50 Day Average For Trading Signals
100 day SMA: This is the line that provides the support between the 50 day and the 200 day. If it does not hold as support, the 200 day generally is the next stop.
200 day SMA: Bulls like to buy dips above the 200-day moving average, while bears sell rallies short below it. Bears usually win and sell into rallies below this line as the 200 day becomes resistance, and bulls buy into deep pullbacks to the 200 day when the price is above it. This line is one of the biggest signals in the market telling you which side to be on. Bull above, Bear below. Bad things happen to stocks and markets when this line is lost.
Rollovers in F&O market- As an indicator
WHAT IS A ROLLOVER?
Rollover involves carrying forward of futures positions from one series, which is nearing expiry date, to the next one. On expiry, traders can either let a position lapse or enter into a similar contract expiring at a future date. Rollovers happen only in futures and not in options.
HOW ARE CONTRACTS ROLLED OVER IN INDIA? HOW DOES IT WORK?
Equity derivatives contracts in India are settled on the last Thursday of every month (if Thursday is a holiday, the settlement happens on a Wednes day). While rollovers are done till the close of trading hours on that day, a chunk of the rollovers begin a week before expiry. Positions are rolled over to the next month through a spread window on the trading terminal. For instance, if a trader holds one futures contract of Nifty expiring in June, he would enter the `carry-forward this position to June' by keying in the spread at which he desires to rollover the positions to July. The spread window has made it easier for traders to rollover, which was a two-step process earlier.
HOW TO INTERPRET ROLLOVERS?
Rollover is expressed as a percentage of total positions. There are no benchmarks for rollovers but they are compared on the basis of historical data, especially the trailing three-month average.
Rollover is an indicator of traders' willingness to carry forward the bets on the market. But, the figures will not tell you in which direction traders have bet. On most occasions, lower-thanaverage rollovers signal uncertainty while higher rollovers show that sentiment is strong. Hypothetically, if rollover in Nifty futures from May series to June is at 70% and three-month av erage is 65%, it means traders are more con vinced about their views on the market and are willing to build more positions.
However, at times, rollover trends can be misleading. For instance, 70% roll over may have taken place at a lower base of open interest -number of outstanding positions -while the average of 65% rolls would have happened at a relatively higher open interest base. Savvy traders also analyse rollover trends on the basis of rollover cost. “Usually, high rollover costs signal that the mood is upbeat in the market,“ said K Anant Rao, an independent derivatives analyst.
Nishanth Vasudevan
ECONOMICTIMES.COM 27.6.14
Technical Analysis on Stock Market : Reading the charts
Technical analysis on stock market
Technical analysisis a method of evaluating securities by analyzing the statistics generated by market activity. It is based on three assumptions: 1) the market discounts everything, 2) price moves in trends and 3) history tends to repeat itself.
Technicians believe that all the information they need about a stock can be found in its charts.
Technical traders take a short-term approach to analyzing the market.
Criticism of technical analysis stems from theefficient market hypothesis, which states that the market price is always the correct one, making any historical analysis useless.
One of the most important concepts in technical analysis is that of atrend, which is the general direction that a security is headed. There are three types of trends:uptrends,downtrendsandsideways/horizontal trends.
Atrendlineis a simple charting technique that adds a line to a chart to represent the trend in the market or a stock.
Achannel, or channel lines, is the addition of two parallel trendlines that act as strong areas of support and resistance.
Supportis the price level through which a stock or market seldom falls.Resistanceis the price level that a stock or market seldom surpasses.
Volumeis the number of shares or contracts that trade over a given period of time, usually a day. The higher the volume, the more active the security.
A chart is a graphical representation of a series of prices over a set time frame.
The time scale refers to the range of dates at the bottom of the chart, which can vary from decades to seconds. The most frequently used time scales areintraday, daily, weekly, monthly,quarterlyand annually.
The price scale is on the right-hand side of the chart. It shows a stock's current price and compares it to past data points. It can be eitherlinearorlogarithmic.
There are four main types of charts used by investors and traders:line charts,bar charts,candlestick chartsandpoint and figure charts.
A chart pattern is a distinct formation on a stock chart that creates a trading signal, or a sign of future price movements. There are two types:reversalandcontinuation.
Ahead and shoulders patternis reversal pattern that signals a security is likely to move against its previous trend.
Acup and handle patternis a bullish continuation pattern in which the upward trend has paused but will continue in an upward direction once the pattern is confirmed.
Double topsanddouble bottomsare formed after a sustained trend and signal to chartists that the trend is about to reverse. The pattern is created when a price movement tests support or resistance levels twice and is unable to break through.
Atriangleis a technical analysis pattern created by drawing trendlines along a price range that gets narrower over time because of lower tops and higher bottoms. Variations of a triangle includeascendinganddescendingtriangles.
Flagsandpennantsare short-term continuation patterns that are formed when there is a sharp price movement followed by a sideways price movement.
Thewedgechart pattern can be either a continuation or reversal pattern. It is similar to a symmetrical triangle except that the wedge pattern slants in an upward or downward direction.
Agapin a chart is an empty space between a trading period and the following trading period. This occurs when there is a large difference in prices between two sequential trading periods.
Triple topsandtriple bottomsare reversal patterns that are formed when the price movement tests a level of support or resistance three times and is unable to break through, signaling a trend reversal.
Arounding bottom(or saucer bottom) is a long-term reversal pattern that signals a shift from a downward trend to an upward trend.
Amoving averageis the average price of a security over a set amount of time. There are three types:simple, linear andexponential.
Moving averages help technical traders smooth out some of thenoisethat is found in day-to-day price movements, giving traders a clearer view of the price trend.
Indicatorsare calculations based on the price and the volume of a security that measure such things as money flow, trends, volatility and momentum. There are two types:leadingandlagging.
Theaccumulation/distributionline is a volume indicator that attempts to measure the ratio of buying to selling of a security.
Theaverage directional index(ADX) is a trend indicator that is used to measure the strength of a current trend.
TheAroon indicatoris a trending indicator used to measure whether a security is in an uptrend or downtrend and the magnitude of that trend.
The Aroon oscillator plots the difference between the Aroon up and down lines by subtracting the two lines.
Themoving average convergence divergence(MACD) is comprised of two exponential moving averages, which help to measure a security'smomentum.
Therelative strength index(RSI) helps to signal overbought and oversold conditions in a security.
Theon-balance volume(OBV) indicator is one of the most well-known technical indicators that reflects movements in volume.
Thestochastic oscillatorcompares a security's closing price to its price range over a given time period.
Retracement Or Reversal: Know The Difference
Most of us have wondered, at some point, whether a decline in the price of a stock we're holding is long term or a mere market hiccup. Some of us have sold our stock in such a situation, only to see it rise to new highs just days later. This is a frustrating and all too common scenario, but it can be avoided if you know how to identify and trade retracements properly.
What Are Retracements?Retracements are temporary price reversals that take place within a larger trend. The key here is that these price reversals are temporary, and do not indicate a change in the larger trend.
The Importance of Recognizing RetracementsIt is important to know how to distinguish a retracement from a reversal.
Factor
Retracement
Reversal
Volume
Profit taking by retail traders (small block trades)
Institutional selling (large block trades
Short Interest
*No change in short interest
Increasing short interest
Time Frame
Short-term reversal, lasting no longer than one to two weeks
Long-term reversal, lasting longer than a couple of weeks
Fundamentals
No change in fundamentals
Change or speculation of change in fundamentals
Recent Activity
Usually occurs right after large gains
Can happen at any time, even during otherwise regular trading
Psychology in Stock Markets
Positive and negative feedback loop
When stocks are rising (a bull market), the belief that further rises are probable gives investors an incentive to buy (positive feedback—reinforcing the rise, see also stock market bubble and momentum investing); but the increased price of the shares, and the knowledge that there must be a peak after which the market falls, ends up deterring buyers (negative feedback—stabilizing the rise).
Industry Weightages In Nifty
Domestic Investors (DII) buying more than FII in India in 2017
To clear the situation, we delve deeper and find out how analysts are placed on each of these stocks where the big investors have taken a contrasting stand.
The stock market is soaring high with abundant liquidity keeping the market buoyant even as companies have struggled to put on a good show. Both foreign and domestic investors have pumped in truck-loads of money over the past one year. However, contrary to the past trends, this time, domestic investors have taken the lead in boosting the market. While foreign institutional investors (FIIs) have bought equities worth Rs 58,268 since July last year,domestic institutional investors (DIIs) have made a bigger splash in the market with net inflows of Rs 84,825 crore. In fact, DIIs have emerged net buyers in the equity market for each month since August last year.
For 196 of the 200 firms in the BSE200 Index, non-promoter foreign institutional ownership increased marginally from 19.18% in June last year to 19.56% at the end of June 2017. Meanwhile, DII holding in the same basket rose from 10.71% to 11.48% during this period.
More interestingly, both sets of investors have taken different paths while buying and sellingstocks. Our study of the shareholding pattern of the BSE200 basket of companies shows that there is not a single company in which both DIIs and FIIs have simultaneously shored up holdings or cut their stake over the past four quarters.
Meanwhile, there are eight companies where the two have taken a sharply divergent view—where one set has increased stake consistently, the other has simultaneously pared down ownership. To clear the situation, we delve deeper and find out how analysts are placed on each of these stocks where the big investors have taken a contrasting stand.
Known - Unknown Framework
SECTOR SPECIFIC VS STOCK SPECIFIC
Buy pharma as a bucket, be stock-specific
in auto: Sudip Bandyopadhyay, Inditrade Capital
ET Now|Updated: Sep 09, 2018, 10.28
What is your assessment of the pharma pack as a whole? Could factors
like the currency and improvement in US business prove to be tailwinds for the
sector as a whole?
Absolutely. We have been positive for some time on the pharma sector
and this is one sector where investors should start moving money definitely.
There are always some uncertainties with pharma companies because of the
regulatory action and the consequences thereof, like we have seen in Sun Pharma
today. But our strategy has been very clearly to buy a basket of pharma
companies so that you avoid the vagaries of individual company related
regulatory action. We have been recommending a basket buy in pharma which
includes Sun, Aurobindo, Natco Pharma, Cadila and Torrent Pharma. For an
investor in a volatile market with depreciating currency, pharma definitely is
a good bet. It has not performed as a sector for quite some time. The valuation
looks attractive. As you rightly pointed out US business is improving and to a
great extent the regulatory action is also behind the industry. Most of the
companies have tried to get their act together. Yes, there may be sporadic
action here and there from US FDA but by and large things have improved
significantly from what it was couple of years back.
How are you looking at the auto space? We have been bullish on auto.
We have been particularly bullish on the commercial vehicle segment and
Ashok Leyland is one company on which we
have been recommending a buy. The commercial vehicle cycle has clearly turned
and that ensures that companies like Ashok Leyland continues to outperform the
expectations. It happened in the first quarter of the current fiscal. They came
up with excellent results. Post that. there was a bit of a correction in prices
due to that government changing the axle load factor but that was a temporary
blip. The larger issue is the vehicle scrappage policy which is being
circulated and which is being talked about. It is a matter of time before the
vehicle scrappage policy comes and that policy is going to help companies like
Ashok Leyland in a big way. We have to keep that in mind. You talked about
environment-friendly vehicles and electric vehicles. Ashok Leyland in the
commercial vehicle space is working on that and they have the capacity to
deliver electronic vehicles as well and that is excellent. Also, they have
started getting a lot of export orders including in double-decker buses where
they have the skill sets. The valuation after correction looks attractive and
we definitely recommend a buy there. In the two-wheeler space, Hero MotoCorp is
definitely a stand out with the rural market getting a lot of attention as this
is an election year. Farm income is expected to increase significantly with
good monsoon. Hero with its outstanding reach in the rural market should
benefit and they should be the outperformers amongst the two-wheeler companies.
There has been some announcements in Bajaj regarding their capacity to deliver
electrical three-wheelers and for that they will not require any licenses. They
are expecting large sales and they have got the export market working for them.
It is a good company to buy into but between the two-wheeler companies, we will
go for Hero MotoCorp.
Nifty & Sensex VS Mid-cap and Small-cap Index - Both to be considered for making any analysis
Sensex not the real picture, India's growth story scripted by small entrepreneurs - to be gauged from mid-cap and small-cap index
As this paper recently argued, the mid-cap- and small-cap indices — the barometer of the real economy — have dived in the past six months, signalling that all's not well with India Inc.
After ET front-paged the article (Is This An Uneasy Lull Before The Crash, Aug 6) that showed theSensexholding at fairly high levels despite the crash in mid- and small-caps, the markets have lost some of their steam. After all, this had to happen because the Sensex — comprising of only 30stocks— is in many ways not a clear indicator of the India Story.
REAL INDIA STORY
The real India Story is being scripted by small entrepreneurs, not the big boys. The big boys anyway have the wherewithal to ride out economic turbulence. It's the small entrepreneurs who are being squeezed dry by the rising cost of funds and plunging order books.
It's the small companies which are becoming uncompetitive because of erratic power supply, dismal infrastructure and rampant corruption. The big boys can take it on the chin and move on, but it's the small companies that are getting hit badly by these bouncers the dismal economy is throwing at a ferocious pace."The environment is not conducive for startups. The odds against a small manufacturer are very high," said Anil Bhardwaj, the secretary-general of the Federation of Indian Micro & Medium Enterprises (FISME). The contrasting fortunes of India's big and small companies are best reflected in stock market data. Policymakers in Delhi gloat over the fact that the market hasn't tanked despite GDP growth slowing down from 9% to 6.5%, and almost 5% now.
The firmness in the market is being seen, perhaps wrongly, as a proof of investor confidence in the India Story, and a steady Dalal Street is being flogged as a sign that global funds think India's troubles are temporary.
This faulty theory has lost some sheen in recent times since it solely focuses on the share-price performance of the 30 big companies that comprise the BSE Sensex, and conveniently ignores the larger market . The same largely can be said of the Nifty 50, where top blue chips determine the perception of the broader economy.
In the past 12 months, the Sensex companies generated a 7.45% return while the BSE mid-cap- and small-cap indices lost more than 10% and 19%, respectively. And from January 1 this year, the Sensex has fallen by just 2.5%, but the mid-cap- and small-cap indices have taken a battering of 23% and 28%, respectively. Contrary to the perception that the markets have held firm, there has actually been mayhem in the markets.
Rajesh Mascarenhas & Javed Sayed, ET Bureau | 13 Aug, 2013
Industry
Company Name
AUTOMOBILE
Bajaj Auto Ltd.
Bosch Ltd.
Hero MotoCorp Ltd.
Mahindra & Mahindra Ltd.
Maruti Suzuki India Ltd.
Tata Motors Ltd.
CEMENT & CEMENT PRODUCTS
ACC Ltd.
Ambuja Cements Ltd.
Grasim Industries Ltd.
UltraTech Cement Ltd.
CONSTRUCTION
Larsen & Toubro Ltd.
CONSUMER GOODS
Asian Paints Ltd.
Hindustan Unilever Ltd.
I T C Ltd.
ENERGY
Bharat Petroleum Corporation Ltd.
Cairn India Ltd.
GAIL (India) Ltd.
NTPC Ltd.
Oil & Natural Gas Corporation Ltd.
Power Grid Corporation of India Ltd.
Reliance Industries Ltd.
Tata Power Co. Ltd.
FINANCIAL SERVICES
Axis Bank Ltd.
Bank of Baroda
HDFC Bank Ltd.
Housing Development Finance Corporation
ICICI Bank Ltd.
IndusInd Bank Ltd.
Kotak Mahindra Bank Ltd.
Punjab National Bank
State Bank of India
Yes Bank Ltd.
INDUSTRIAL MANUFACTURING
Bharat Heavy Electricals Ltd.
IT
HCL Technologies Ltd.
Infosys Ltd.
Tata Consultancy Services Ltd.
Tech Mahindra Ltd.
Wipro Ltd.
MEDIA & ENTERTAINMENT
Zee Entertainment Enterprises Ltd.
METALS
Coal India Ltd.
Hindalco Industries Ltd.
Tata Steel Ltd.
Vedanta Ltd.
PHARMA
Cipla Ltd.
Dr. Reddy's Laboratories Ltd.
Lupin Ltd.
Sun Pharmaceutical Industries Ltd.
SERVICES
Adani Ports and Special Economic Zone Ltd.
TELECOM
Bharti Airtel Ltd.
Idea Cellular Ltd.
Stock Market Anecdotes
Irrational Markets
while the irrationality of markets offers opportunities, just remember
John Maynard Keynes “the market can stay irrational longer than you can stay solvent.”
How long an Event will impact Market
Monkey Story on Stock Markets
Once Upon A Time In A Village, A Man Appeared And Announced To The Villagers That He Would Buy Monkeys For $10/-
The Villagers Seeing That There Were Many Monkeys Around, Went Out To The Forest And Started Catching Them. The Man Bought Thousands At $10/- And As Supply Started To Diminish, The Villagers Stopped Their Effort. He Further Announced That He Would Now Buy At $20/- This Renewed The Efforts Of The Villagers And They Started Catching Monkeys Again.
Soon The Supply Diminished Even Further And People Started Going Back To Their Farms. The Offer Rate Increased To $25/- And The Supply Of Monkeys Became So Little That It Was An Effort To Even See A Monkey, Let Alone Catch It! The Man Now Announced That He Would Buy Monkeys At $50! However, Since He Had To Go To The City On Some Business, His Assistant Would Now Buy On Behalf Of Him.
In The Absence Of The Man, The Assistant Told The Villagers. Look At All These Monkeys In The Big Cage That The Man Has Collected. I Will Sell Them To You At $35 And When The Man Returns From The City, You Can Sell It To Him For $50/-
The Villagers Squeezed Up With All Their Savings And Bought All The Monkeys.
Then They Never Saw The Man Nor His Assistant, Only Monkeys Everywhere!! !
Welcome To The 'Stock' Market!!!!!
Ashutosh Joshi/The Wall Street Journal
The Grandmother With Faith in Indian Stocks
Ashalata Maheshwari, right, at her residence in Mumbai.
At a time when individuals in India are disenchanted with the stock market, Mumbai resident Ashalata Maheshwari, 77 years old, is a rare champion for stocks.
Ms. Maheshwari has been investing in Indian companies for five decades, and though many have gone bust over the years, shares in others have gained enough value to give her confidence that equities are the best investments over the long term.
“Stocks have given me the best returns because I have rarely sold them,” Ms. Maheshwari told The Wall Street Journal in an interview at her Mumbai home. “Patience is key to stock market investments,” she said.
The Reserve Bank of India says stocks comprise less than 5% of the savings of Indian households, which have traditionally invested in gold and real estate.
Many individuals turned to the stock market for the first time between 2007 and 2009 when India was booming and people had plenty of disposable income. But the financial downturn has hurt. India’s benchmark BSE S&P Sensex is off about 9% from record levels seen in early 2008.
Ms. Maheshwari is unfazed because stocks have risen over the long term. In the last 20 years, the BSE S&P Sensex has gained 11.4% on average annually. The gains are much higher if dividend income and bonus shares are taken into account. Over the same period, the value of gold has risen about 10% a year.
Ms. Maheshwari says her portfolio of 1,500 stocks is worth around 40 million rupees ($660,000). She says she owns most of the stocks for the dividends they pay, and plans to hold on to them for years.
Ms. Maheshwari says she is a hands-on investor who wades through companies’ financial statements. She has become a regular fixture at the annual general meetings of India’s largest firms, such as Reliance Industries Ltd. and Tata group companies, where she often asks for higher dividends and updates on planned projects.
To get her message across at these meetings, Ms. Maheshwari has occasionally burst into poem or song about a chief executive or directors. This has left a mark on many.
“[She] has been among those shareholders of Tata companies who, though individuals, are an institution,” Ratan Tata, the former chairman of the Tata group told The Wall Street Journal. “For as long as I can remember, she would be the most vocal lady shareholder-speaker in a bastion of men at AGMs. I believe she has inspired many women and youngsters to become engaged investors,” Mr. Tata said.
At Reliance Industry’s annual meeting in June, Ms. Maheshwari had a question for chief executive Mukesh Ambani, who earlier this year got Z-level security, the second-highest level of security in India.
Standing before an audience of around 1,000 Reliance shareholders and executives, Ms. Maheshwari said that if Mr. Ambani got “Z” security, shareholders should at least get “ABCD,” with A representing appreciation, B for bonus, C for cash, and D for dividends.
A Reliance spokesman said in June that Ms. Maheshwari’s and other investors’ demands were pending with the board. He didn’t respond to a recent call for comment. For last fiscal year, Reliance Industries paid a dividend of nine rupees a share.
Ms. Maheshwari says Reliance Industries is one of the best performing stocks in her portfolio, along with Tata Motors Ltd., software firm Tata Consultancy Ltd., engineering firm Larsen & Toubro Ltd. and toothpaste maker Colgate-Palmolive (India) Ltd. She says these stocks have risen by 10 times to 25 times since she bought them.
She says returns on stocks helped her to buy her home in Santacruz, a posh Mumbai neighborhood, for 80,000 rupees in 1972. “Today this house should be worth 50 million to 60 million rupees,” she said.
Ms. Maheshwari, a high school graduate, was introduced to stocks when she was 21. Her father-in-law gave her 1,000 shares of Grasim Industries Ltd., then a textile company, as a wedding gift in 1954.
“That time I didn’t even know what these pieces of paper meant,” she said, referring to the stock certificates.
Ms. Maheshwari says she realized their value after she started getting dividend checks regularly. “I decided to put more of my savings into stocks and made it a habit,” she said.
Over the years, her husband J.P. Maheshwari, who used to run a plastic products manufacturing business, started helping her.
Now, the two of them spend their days monitoring financial TV channels to get news on companies, stock markets and the economy, regularly trading on a pool of 100 to 200 stocks in Ms. Maheshwari’s portfolio.
She says she doesn’t always believe in analyst commentary and instead studies companies’ financial statements, annual reports, and dividend and bonus history before deciding on whether to invest in a stock or not.
“Balance sheets will always reveal the truth,” she said.
Ms. Maheshwari plans to be an active shareholder for many more years, and rues that there aren’t enough investors asking companies tough questions, especially at shareholder meetings.
“Investors should come prepared and throw valid questions to company managements… I don’t see that happening,” she said.
Seemingly Simple Strategy of "Buy and Hold a blue chip forever" is also risky.
Why holding a blue chip stock forever a very risky investing strategy
There are people who are keen to over simplify equity investing. Buy blue chips and hold on to them forever, they would say. As long as you have bought a good stock, you don't have to worry — you will get a great return. Such advice is a huge dis-service to keen new investors. Much as we love to hear it, there is no sure-fire way to make money in stocks. Think about it: if the return is higher than all other choices, how can it be easy? To assume that you can buy and hold and be rewarded for sheer laziness is preposterous.
I will take you back to 1985, the first stock market boom that I watched. The market leader was Century Mills. It was the largest single-unit textile mill in the country, located in the heart of the mill district of Parel-Worli in Mumbai. Set up in 1897 and run by the Birla family, it was the darling of the markets. Then there was Gujarat Narmada Valley Fertilisers. A revolutionary company that roped in farmers as shareholders to completely modify how fertilisers were made and sold. Scindia Shipping, with its debt and cyclical revenue was also a blue-chip. There were respectful references to Mukund Iron from the Bajaj family, for being an efficient steel maker. The 1980s belonged to the Indian companies that made it big in manufacturing.
Of the 30 bluest of blue chips included in the BSE Sensitive Index which was constructed in 1984 (back calculated to 1980) only seven remain today. Century mills stopped manufacturing in 2006 and the land is now being redeveloped commercially. GSFC, Scindia and 23 other blue chips of those days are significantly bruised or have closed shop.
An investor who bought these blue chips in 1980 held on to them for 35 long years will find that he is now left with a few duds. The biggest problem in equity investing is the hindsight bias. We all like to think that somehow we would have foreseen the decline of these companies and gotten out of them at the right time, and moved on to the new blue chips.
The truth is that we would have been clueless. Either we would have failed to see that our stocks are declining, given their illustrious past. Or we would be wary of the new claimants to the blue chip title and unwilling to buy them. It is a fallacy that we would have remained on top of the league by design.
I always dismiss the success stories about buying few stocks and making a pile on it, as luck. It is a piece of irrelevant and useless information to a new investor, when his uncle tells him how he bought the shares of Colgate at Rs 11 and is earning a fat dividend, or how his investment in Reliance Industries has paid for itself over the years. What matters is a replicable strategy.
Since no one has seen the future, even the best stock picking strategy can go wrong. It can only be a matter of chance that something picked up and held for years still remains good.
Then how is it that people talk of returns of 16-17 per cent per annum on equity? How do they use the Sensex to show how it has grown over a period of time, to deliver fantastic returns?
Two key differences here. One, Sensex is not a stock, it is a portfolio. Two, Sensex components have been consistently revised. When you do not stop at simply picking a stock, but picking many stocks to make a portfolio, you build in the benefit of diversification.
A portfolio is the first cushion for wrong selection. And then, you build in a discipline for revision. You admit that you could have gone wrong, or you accept that circumstances may change to make your today's blue chip tomorrow's dud. You therefore put in place the rules for throwing out what is not working and replacing it with what is working.
That is how the index revision committees work. When they hear about a scandal, as in case of Satyam, they throw it out of the index. When they find the new technology, telecom and banking stocks growing big in size and posting consistent profits, they replace them for the steel, auto, and shipping stocks in the index. So the idea of passively buying something and holding on it to for life, is actually a very risky investing strategy.
It is not a sure-fire way to equity riches, since the real process is one where you have to make decisions about what goes out and what comes in, and allow for errors while you do all that.
Should one invest in blue chips at all? Yes, the core portfolio of an investor should be made up of solid profit-making companies that are market leaders. This buffers the decisions you may make with new and unknown stocks. Such a portfolio of blue chips, also enables you to capture the equity returns over a long term. Buy the index itself (ETFs and index funds are the cheapest routes to buying blue chip equity portfolios) or trust diversified large cap equity funds to do the job for you (every fund house has this product). When you do so, allow yourself to appreciate that someone else is modifying the large cap portfolio to a discipline or a process, on your behalf. Money is not being made by simply sitting around.
If you do insist that you will build your own equity portfolio, blue chips is a good place to begin. However, be sure that the criterion for including them in your portfolio are written down like golden rules. When a stock in your portfolio slips, you have to make a decision. You can get one or both ends of the decision wrong — the stock you sold could get better, and the stock you bought could become worse. But those are the risks in equity investing, and you have to be sure that you enjoy the journey of analysis, observation, harsh lessons of failure, and fun moments of magic.
The next time you hear someone tell you his old story of a multi-bagger, unless it was a company he promoted and built with his own hands, it might be a good idea to simply snigger.
By Uma Shashikant (The author is Managing Director, Centre for Investment Education and Learning)
9 Feb, 2015 Economic Times
Model of surviving on dividends and sticking to Blue Chips Vs Pitfalls in Buy and Hold forever strategy
Stocks that have fallen down and not recovered while market has fallen and recovered between 2008 and 2013
Warren Buffett
Warren E. Buffett first took control of Berkshire Hathaway Inc., a small textile company, in April of 1965. A share was quoting at around $18 at that time. Forty-eight years later, the same share traded for $134,060, compounding investor capital at just under 21% per year -- a multiplier of 7,448 times
Warren Buffett annual letter : The latest one to include a section on investing advice
Berkshire Hathaway Inc. investors will be looking for details of how the conglomerate performed and the best advice chief executive Warren Buffett, a prominent American businessman, has to offer in his annual letter this Saturday.
Investors follow Berkshire because of Buffett's remarkable investing track record and because the conglomerate's results offer a glimpse into a variety of industries
. Buffett's letter is always well-read because of his track record, but this year he released a section focused on investing advice early so there may not be many surprises.
Warren Buffett seeks out a firm's intrinsic value and waits for the market to adjust accordingly over time, George Soros relies on short-term volatility and highly leveraged transactions
In the short run, investment success can be accomplished in a myriad of ways. Speculators and day traders often deliver extraordinary high rates of return, sometimes within a few hours. Generating a superior rate of return consistently over a further time horizon, however, requires a masterful understanding of the market mechanisms and a definitive investment strategy. Two such market players fit the bill: Warren Buffett and George Soros.
Warren Buffett Known as "the Oracle of Omaha," Warren Buffett made his first investment at the tender age of 11. In his early 20s, the young prodigy would study at Columbia University, under the father of value investing and his personal mentor, Benjamin Graham. Graham argued that every security had an intrinsic value that was independent of its market price, instilling in Buffett the knowledge with which he would build his conglomerate empire. Shortly after graduating he formed "Buffett Partnership" and never looked back. Over time, the firm evolved into "Berkshire Hathaway," with a market capitalization over $200 billion. Each stock share is valued at near $130,000, as Buffett refuses to perform a stock split on his company's ownership shares.
Warren Buffett is a value investor. He is constantly on the lookout for investment opportunities where he can exploit price imbalances over an extended time horizon.
Buffett is an arbitrageur who is known to instruct his followers to "be fearful when others are greedy, and be greedy when others are fearful." Much of his success can be attributed to Graham's three cardinal rules: invest with a margin of safety, profit from volatility and know yourself. As such, Warren Buffett has the ability to suppress his emotion and execute these rules in the face of economic fluctuations.
George Soros Another 21st century financial titan, George Soros was born in Budapest in 1930, fleeing the country after WWII to escape communism. Fittingly, Soros subscribes to the concept of "reflexivity" social theory, adopting a "a set of ideas that seeks to explain how a feedback mechanism can skew how participants in a market value assets on that market."
Graduating from the London School of Economics some years later, Soros would go on to create the Quantum Fund. Managing this fund from 1973 to 2011, Soros returned roughly 20% to investors annually. The Quantum Fund decided to shut down based on "new financial regulations requiring hedge funds to register with the Securities and Exchange Commission." Soros continues to take an active role in the administration of Soros Fund Management, another hedge fund he founded.
Where Buffett seeks out a firm's intrinsic value and waits for the market to adjust accordingly over time, Soros relies on short-term volatility and highly leveraged transactions. In short, Soros is a speculator. The fundamentals of a prospective investment, while important at times, play a minor role in his decision-making.
In fact, in the early 1990s, Soros made a multi-billion dollar bet that the British pound would significantly depreciate in value over the course of a single day of trading. In essence, he was directly battling the British central banking system in its attempt to keep the pound artificially competitive in foreign exchange markets. Soros, of course, made a tidy $1 billion off the deal. As a result, we know him today as the man "who broke the bank of England."The Bottom Line Warren Buffett and George Soros are contemporary examples of the some of the most brilliant minds in the history of investing. While they employ markedly different investing strategies, both men have achieved great success. Investors can learn much from even a basic understanding of their investment strategies and techniques.
Bill Gross: I’m not a great investor and Warren Buffett, George Soros may not be either
Warren Buffett was in market at the right.He used simple principles.If his track was extra-ordnianry it has to do with the time he entered than his skills.Perhaps it was the epoch that made the man as opposed to the man that made the epoch
“Am I a great investor? No, not yet.”So writes Bill Gross, manager of the world’s largest mutual fund, in his latest investment outlook.
Gross also said the most renowned investors from Warren Buffett to George Soros may owe their reputations to a favorable era for money management as expanding credit fueled gains in asset prices across markets.
The real test of greatness for investors is not how they navigated market cycles during that time, but whether they can adapt to historical changes occurring over half a century or longer, Gross, 67, wrote in the outlook entitled “A Man in the Mirror,” which is the name of a song by Michael Jackson.
Buffett, Soros, Fuss, yeah – me too, have cut our teeth during perhaps a most advantageous period of time . . . an investor could experience
“All of us, even the old guys like Buffett, Soros, Fuss, yeah – me too, have cut our teeth during perhaps a most advantageous period of time, the most attractive epoch, that an investor could experience,” Gross wrote. “Perhaps it was the epoch that made the man as opposed to the man that made the epoch.”
Gross, one of the co-founders in 1971 of Pacific Investment Management Co (PIMCO), is often referred to in the media as “the bond king.” He runs the US$289-billion Pimco Total Return Fund, which has advanced 7.9% over the past five years to beat 94% of peers.
Gross is examining his legacy as the bond shop he built over four decades is seeking to adapt to an environment that looks very different from the bull market that fueled Pimco’s growth to one of the largest money managers in the world. The prospect of elevated market volatility, an aging population and climate change could make investing far more challenging in the coming decades, Gross said.
‘New Normal’
Pimco in 2009 started an expansion into equities to prepare for an eventual end of the decades-long bond rally. Gross, whose firm coined the term “new normal” that year to describe an economic environment characterized by below-average growth, elevated unemployment and a declining role for the U.S. in the global economy, suggested those changes could potentially be part of a longer-lasting shift.
“What if zero-bound interest rates define the end of a total return epoch that began in the 1970s, accelerated in 1981 and has come to a mathematical dead-end for bonds in 2012/2013 and commonsensically for other conjoined asset classes as well?” Gross wrote. “What if quantitative easing policies eventually collapse instead of elevate asset prices?”
Soros is the legendary hedge-fund manager best known for a 1992 bet that the Bank of England would be forced to devalue the pound. Buffett is the chief executive officer of Berkshire Hathaway Inc. who built the firm over almost five decades through takeovers and prescient stock picks, and Daniel Fuss is a bond manager who runs the top-performing Loomis Sayles Bond Fund.
‘Achilles Heel’
Gross said investors such as Bill Miller, the stock picker who beat the Standard & Poor’s 500 Index for a record 15 years before his streak ended in 2005, are prone to exposing their “Achilles heel” the longer they stay in the money-management business. Miller may, in fact, be a great investor, although he would need five or six more years on top to prove it, Gross said. Peter Lynch, the Fidelity Investments manager who ran the Magellan fund, made a smart move by leaving when the “gettin’ was good,” according to Gross. Lynch earned the highest returns in the industry from 1977 to 1990, averaging annual gains of 29% before stepping down.
“There is not a Bond King or a Stock King or an Investor Sovereign alive that can claim title to a throne,” Gross said.
The Equity Cult is dead PIMCO Bill Gross and the Counter argument: Long Live Equities The cult of equity is dying. Like a once bright green aspen turning to subtle shades of yellow then red in the Colorado fall, investors' impressions of "stocks for the long run" or any run have mellowed as well. I "tweeted" last month that the souring attitude might be a generational thing: "Boomers can't take risk. Gen X and Y believe in Facebook but not its stock. Gen Z has no money." True enough, but my tweetering 95-character message still didn't answer the question as to where the love or the aspen-like green went, and why it seemed to disappear so quickly. Several generations were weaned and in fact grew wealthier believing that pieces of paper representing "shares" of future profits were something more than a conditional IOU that came with risk. Hadn't history confirmed it? Jeremy Siegel's rather ill-timed book affirming the equity cult, published in the late 1990s, allowed for brief cyclical bear markets, but showered scorn on any heretic willing to question the inevitability of a decade-long period of upside stock market performance compared to the alternatives. Now in 2012, however, an investor can periodically compare the return of stocks for the past 10, 20 and 30 years, and find that long-term Treasury bonds have been the higher returning and obviously "safer" investment than a diversified portfolio of equities. In turn it would show that higher risk is usually, but notalways, rewarded with excess return.Got Stocks? Chart 1 displays a rather different storyline, one which overwhelmingly favors stocks over a century's time – truly the long run. This long-term history of inflation adjusted returns from stocks shows a persistent but recently fading 6.6% real return (known as the Siegel constant) since 1912 that Generations X and Y perhaps should study more closely. Had they been alive in 1912 and lived to the ripe old age of 100, they would have turned what on the graph appears to be a $1 investment into more than $500 (inflation adjusted) over the interim. No wonder today's Boomers became Siegel disciples. Letting money do the hard work instead of working hard for the money was an historical inevitability it seemed.
Yet the 6.6% real return belied a commonsensical flaw much like that of a chain letter or yes – a Ponzi scheme.If wealth or real GDP was only being created at an annual rate of 3.5% over the same period of time, then somehow stockholders must be skimming 3% off the top each and every year. If an economy's GDP could only provide 3.5% more goods and services per year, then how could one segment (stockholders) so consistently profit at the expense of the others (lenders, laborers and government)?The commonsensical "illogic" of such an arrangement when carried forward another century to 2112 seems obvious as well. If stocks continue to appreciate at a 3% higher rate than the economy itself, then stockholders will command not only a disproportionate share of wealth but nearly all of the money in the world! Owners of "shares" using the rather simple "rule of 72" would double their advantage every 24 years and in another century's time would have 16 times as much as the sceptics who decided to skip class and play hooky from the stock market.
Cult followers, despite this logic, still have the argument of history on their side and it deserves an explanation. Has the past 100-year experience shown in Chart 1 really been comparable to a chain letter which eventually exhausts its momentum due to a lack of willing players? In part, but not entirely.Common sense would argue that appropriately priced stocks should return more than bonds. Their dividends are variable, their cash flows less certain and therefore an equity risk premium should exist which compensates stockholders for their junior position in the capital structure. Companies typically borrow money at less than their return on equity and therefore compound their return at the expense of lenders. If GDP and wealth grew at 3.5% per year then it seems only reasonable that the bondholder should have gotten a little bit less and the stockholder something more than that. Long-term historical returns for Treasury bill and government/corporate bondholders validate that logic, and it seems sensible to assume that same relationship for the next 100 years. "Stocks for thereallylong run" would have been a better Siegel book title.
Yet despite the past 30-year history of stock and bond returns that belie thereallylong term, it is not the future win/place perfecta order of finish that I quarrel with, but its 6.6% "constant" real return assumption and the huge historical advantage that stocks presumably command. Chart 2 points out one of the additional reasons why equities have done so well compared to GNP/wealth creation. Economists will confirm that not only the return differentials within capital itself (bonds versus stocks to keep it simple) but the division of GDP between capital, labor and government can significantly advantage one sector versus the other. Chart 2 confirms that real wage gains for labor have been declining as a percentage of GDP since the early 1970s, a 40-year stretch which has yielded the majority of the past century's real return advantage to stocks. Labor gaveth, capital tooketh away in part due to the significant shift to globalization and the utilization of cheaper emerging market labor. In addition, government has conceded a piece of their GDP share via lower taxes over the same time period. Corporate tax rates are now at 30-year lows as a percentage of GDP and it is therefore not too surprising that those 6.6% historical real returns were 3% higher than actual wealth creation for such a long period.
The legitimate question that market analysts, government forecasters and pension consultants should answer is how that 6.6% real return can possibly be duplicated in the future given today's initial conditions which historically have never been more favorable for corporate profits.If labor and indeed government must demand some recompense for the four decade's long downward tilting teeter-totter of wealth creation, and if GDP growth itself is slowing significantly due to deleveraging in a New Normal economy, then how can stocks appreciate at 6.6% real? They cannot, absent a productivity miracle that resembles Apple's wizardry.
Got Bonds?
My ultimate destination in thisInvestment Outlooklies a few paragraphs ahead so let me lay its foundation by dissing and dismissing the past 30 years' experience of the bond market as well.With long Treasuries currently yielding 2.55%, it is even more of a stretch to assume that long-term bonds – and the bond market – will replicate the performance of decades past.The Barclay's U.S. Aggregate Bond Index – a composite of investment grade bonds and mortgages – today yields only 1.8% with an average maturity of 6–7 years. Capital gains legitimately emanate from singular starting points of 14½%, as in 1981, not the current level in 2012. What you see is what you get more often than not in the bond market, so momentum-following investors are bound to be disappointed if they look to the bond market's past 30-year history for future salvation, instead of mere survival at the current level of interest rates.
Together then, a presumed 2% return for bonds and an historically low percentagenominalreturn for stocks – call it 4%, when combined in a diversified portfolio produce anominalreturn of 3% and an expected inflation adjusted return nearzero.The Siegel constant of 6.6% realappreciation, therefore, is an historical freak, a mutation likely never to be seen again as far as we mortals are concerned.The simple point though whether approached in realornominal space is that U.S. and global economies will undergo substantial change if they mistakenly expect asset price appreciation to do the heavy lifting over the next few decades. Private pension funds, government budgets and household savings balances have in many cases been predicated and justified on the basis of 7–8% minimum asset appreciation annually. One of the country's largest state pension funds for instance recently assumed that its diversified portfolio would appreciate at a real rate of 4.75%. Assuming a goodly portion of that is in bonds yielding at 1–2% real, then stocks must do some very heavy lifting at 7–8% after adjusting for inflation. That is unlikely. If/when that does not happen, then the economy's wheels start spinning like a two-wheel-drive sedan on a sandy beach. Instead of thrusting forward, spending patterns flatline or reverse; instead of thriving, a growing number of households and corporations experience a haircut of wealth and/or default; instead of returning to old norms, economies begin to resemble the lost decades of Japan.
Some of the adjustments are already occurring. Recent elections in San Jose and San Diego, California, have mandated haircuts to pensions for government employees. Wisconsin's failed gubernational recall validated the same sentiment. Voided private pensions of auto and auto parts suppliers following Lehman 2008 may be a forerunner as well for private corporations.The commonsensical conclusion is clear: If financial assets no longer work for you at a rate far and above the rate of true wealth creation, then you must work longer for your money, suffer a haircut on your existing holdings and entitlements, or both. There are still tricks to be played and gimmicks to be employed. For example – the accounting legislation just passed into law by the Congress and signed by the President allows corporations to discount liabilities at an average yield for the past 25 years! But accounting acts of magic aside, this and other developed countries have for too long made promises they can't keep, especially if asset markets fail to respond as they have historically.
Reflating to Prosperity
The primary magic potion that policymakers have always applied in such a predicament is to inflate their way out of the corner. The easiest way to produce 7–8% yields for bonds over the next 30 years is to inflate them as quickly as possible to 7–8%! Woe to the holder of long-term bonds in the process! Similarly for stocks because they fare poorly as well in inflationary periods. Yet if profits can be reflated to 5–10% annual growth rates, if the U.S. economy can grow nominally at 6–7% as it did in the 70s and 80s, then America's and indeed the global economy's liabilities can be "reflated" away. The problem with all of that of course is that inflation doesn't create real wealth and it doesn't fairly distribute its pain and benefits to labor/government/or corporate interests.Unfair though it may be, an investor should continue to expect an attempted inflationary solution in almost all developed economies over the next few years and even decades.Financial repression, QEs of all sorts and sizes, and even negative nominal interest rates now experienced in Switzerland and five other Euroland countries may dominate the timescape. The cult of equity may be dying, but the cult of inflation may only have just begun.
William H. Gross
Managing Director
The counter Argument
DEAR PIMCO: Would Bill Gross Maybe Like To Update His Analysis Of Stocks?
Even brilliant people occasionally make boneheaded mistakes, and one of the world's most prominent investors appears to have made a big one.
Yesterday,Bill Gross, the bond king at bond giantPIMCO,published an analysis of of the stock market that instantly grabbed everyone's attention.
Arguing that the "cult of equities" is dying or dead (true--and, ironically, a bullish observation), Gross went on to ridicule the idea that stocks will have the same long-term returns in the future as they have had in the past--for one simple reason:
If stocks appreciate at ~7% a year forever, while GDP only grows at ~3%, the stock market will soon be worth more than the entire world.
At first blush, this seems like an obvious but profound observation, one that would make every equity strategist, scholar, and financial advisor who has ever cited the ~7% long-term stock return (after adjusting for inflation) look and feel like a moron.
Alas, it's wrong.
And after chewing through the analysis, in fact, most observers came away thinking that Bill Gross should probably stick to bonds.
Why is Gross wrong?
Because stocks actually havenot"appreciated" at ~7% a year.
Stocks havereturned~7% a year.
Why is this distinction important? Because there is a big difference between "appreciate" and "return." And Bill Gross, importantly, used the word "appreciate":
If stocks continue toappreciateat a 3% higher rate than the economy itself, then stockholders will command not only a disproportionate share of wealth but nearly all of the money in the world! Owners of "shares" using the rather simple "rule of 72" would double their advantage every 24 years and in another century's time would have 16 times as much as the sceptics who decided to skip class and play hooky from the stock market.
Again, stocks have not, in fact, "appreciated" at ~7% per year for the past couple hundred years. Stocks have only "appreciated" about 2% per year.
That is to say, the prices of stocks, after adjusting for inflation, have only risen about 2% per year for the past couple of centuries.
So where has the rest of the return come from?
Dividends.
Over the past century, about 4 points of the ~7% annual return of stocks has come from dividends.
Companies have paid out cash to their shareholders, and these shareholders have either used the cash to buy more shares (from someone else--not usually from the company) or used the cash to buy other stuff. Either way, the dividend part of the stock "return" is then recycled back into the economy.
This is a very fundamental mistake. And for an investor with Gross's stature, responsibilities, and following, it's highly embarrassing. Here's hoping he acknowledges and corrects it.
Addendum:By the way, Bill Gross is probably absolutely right that stocks will return less in the future than they have in the past, but not for the reason he suggests. The reason stocks will likely return less in the future is that 1) stocks are still overvalued relative to historical averages, 2) dividends are much lower than historical averages, and 3) profit margins are much higher than average, suggesting that they will soon drop. All of these factors suggest that equities will return about ~2%-3% real over the next decade instead of the ~7% average. But this has nothing to do with the flawed idea that stocks can't return more than GDP.
Bill Gross also makes another very important point about how corporations and shareholders have become greedy in recent years and now pay an all-time-low percent of GDP as wages. This is a big problem, one that will have to change if the economy is to heal itself. I've discussed this issue frequently: As companies pay employees more, margins will drop, which will hurt stock performance (see point 3 above). But, again, this has nothing to do with the claim that stocks can't return more than GDP.
ByHenry Blodget|Daily Ticker – Wed, Aug 1, 2012
East India company shares crash on London stock Exchange on news of attack by Hyder Ali, Sultan of Mysore For almost ten years following Plassey, East India Company shares had become the focus of intense international speculative activity, pumped up by successive announcements of ever-grander acquisitions in the East.
Between February 1758 when news of the victory at Plassey reached London and December 1768, when the Company bought the land for the Bengal Warehouse, the Company’s shares had doubled to stand at £276. But this was to bethe peak of the boom.
Five months later, in May 1769, news reached London that not only had a French fleet entered the Indian Ocean, but that Hyder Ali, Sultan of Mysore, had invaded the Company’s possessions in south India. The share price fell 16 per cent in a single month, and would continue a downward course for the next 15 years, reaching the depths of £122 in July 1784, a fall of 55 percent.
Eventhough East India company emerged stronger after Hyder Ali attack, the fall triggered by it could not be reversed for next 40 years until 1824.
MULTI BAGEERS
For years, these two Lucknowmen burnt their fingers in the stock market: they picked wrong companies in their desperate hunt for multibagger returns, and the ones on which they got it right, they sold out too early!
Today, the Mittal brothers laugh when they talk about that phase; they look at it as learning. Over time, they have grown as investors and made far more money than what they lost back then.
Ayush Mittal is just 33 and his brotherPratyush Mittal, 29. Over the past decade or so, they have developed a flair for spotting potential value bets among smaller companies and made big money on them.
Their father SP Mittal, now 60, has been a full-time stock investor since 1980s.
Based in Lucknow, a hot bed for Mughlai cuisine consisting of dishes developed in Medieval India at the centre of the Mughal Empire, the Mittal brothers picked sea food manufacturing company Avanti Feeds in 2011 at Rs 7 (adjusted price). Today, that stock trades at Rs 1,700, indicating a 24,185 per cent rise in just six years. And it is still part of their portfolio. Mittals believe collaborative research can guarantee extraordinary returns in the stock market. Anyone with investing discipline and hard work can generate good returns on Dalal Street, they claim.
The two have since created a tool, named www.screener.in, for investors to do their own research before betting on a stock.
Their father S P Mittal himself made it big in his heydays: picking Cipla in 1985 and DLF in the 1990s. He sold DLF in 2007 after its listing on BSE but still holds Cipla in his portfolio.
Ayush and Pratyush are CA by qualification. They have been investing in stocks since their early 20s.
They invested in Astral Poly at about Rs 25 in 2011 and exited it a few months back at about Rs 425. Today, the stock trades at over Rs 600. The company is a leader in CPVC plumbing pipes and has been a big beneficiary of the switch from GI pipes to CPVC pipes.
ETMarkets.com could not independently verify Mittal brothers' holdings at present or back then.
Investment strategy
Mittal brothers say they prefer midcap and smallcap companies. They burn midnight oil, trying to identify stocks that can grow at above-normal pace and multiply wealth over time. Usually, such names are not very popular, they claim. investors looking for quality business, fundamentals and past track record are important, says Ayush Mittal.
"One has to do some bit of homework, and it is possible to come across promising companies run by some fantastic entrepreneurs," he said.
And to spot multibaggers, it is essential to understand the underlying business model of a company.
"An investor should look at them like a part owner and try to understand the business and the unique proposition that can drive the company to success," Ayush said.
Sometimes it is possible to get a quality company at throwaway price due to wrong perception or bad mood of the market, he smirks.
Multibagger returns
The Mittal brothers claim a number of stocks delivered them multibagger returns over the years. Here is a list of stocks that they are still holding in their portfolio.
Advice for new investors
The stock market is like an ocean; it will give you what you seek, says Ayush Mittal.
"You can seek quick money by trading or you can create a lot of wealth by focusing on the longer term and partnering with good companies early. Doing the latter is easier, more knowledgeable and more rewarding," he insists.
He has a simple tip for new investors. Look around you; most of the products you are using are sold by listed companies. A look at their long-term price charts would tell you that they are massive wealth creators. Look atMaruti Suzuki, Hero MotoCorp, Jockey (Page Industries), Eicher (Royal Enfield) and HDFC Bank – names they grew bigger right in front of you.
"Try to observe good products, businesses around you, check out their financials and if it makes sense, become a part owner when things are in your favour," says he.
"Don't come to market with the intention of buying today and selling in a few days, weeks or months. Try to invest in companies for years," advises Ayush Mittal.
Mittal brothers believe big wealth creation happens when a small or mid-sized company transitions into its next phase. Usually, it happens due to a differentiated business model, focused management and high growth rates. This all can lead to huge re-rating in valuations and create multibagger returns.
One crucial element to look out for is cash flow. Participate in companies that throw out cash. The Mittals prefer companies that have a smaller equity base, do not raise capital from market and have low debt-equity ratios.
They say they met with failure early in life for picking wrong companies that looked great in terms of various valuation ratios, but all of that turned out to be fraudulent or manipulated.
Not allocating enough capital to a stock was another mistake we kept on making in many instances. "In some cases, we sold some excellent ideas too early," Ayush recalls.
Sector wise views and Analysis of stock Market moves
USFDA observations :
Dec 2016 : Divi's Laboratories received form 483 with five observations during its routine Visakhapatnam (Unit-II) inspection which was carried out between November 29- December 6 by US Food and Drug Administration (USFDA). Divi's Laboratories ended 21.87% per cent lower at Rs 866.10. It hit a 52-week low of 821.35 and a high of Rs 1,109.50 on Friday.
The five observations are explained by the USFDA highlighted that no proper control was exercised over a computer system, facility equipment were not maintained to ensure purity quality strength, and documentation and records are not maintained or were inaccurate falsified. Divi's set up its second manufacturing facility at Visakhapatnam (Unit-II) in the year 2002 on a 350- acre site. The site has 14 multi-purpose production blocks. The company manufactures APIs and intermediates for generics among others at the manufacturing plant.
Leveraged Companies stocks wakeup to reality suddenly,once in a while : Aug 2015 Amtek Auto’s market capitalization fell by Rs. 3,000 crores in 1 month during Aug 2015
Leverage Effect
While Amtek Auto was profitable, in none of the historical years since 2005 did the company generate enough cash flows for the bond and the equity shareholders. For example: In FY 2014, the company generated cash flow from operations (CFO) of Rs. 1,119 crores and had debt of Rs. 7,789 crores on its Balance Sheet.Amtek Auto’s Debt increased from Rs. 1,274 crores in FY 2007 to Rs. 7,779 crores in FY 2014, 30% CAGR in the last 7 years. Assuming a 5 year loan, repayment of 20% of the principal and 12% p.a. interest rate translates to Rs. 2,489 crores cash flow to debt holders for the captioned year. This translates to a shortfall of Rs. 1,370 crores (1,119 - 2,489) for the providers of debt. When principal and interest repayment to debt-holders is circumspect, the question of providing cash flow to equity shareholders is at best illusory.
Dismal May IIP: Capital goods shares falter after a strong 1-month rally : 13th July 2015
Shares of capital goods firms eased in early trade Monday following a disappointing performance from the segment in the recently released May IIP numbers.
As per the data released by the government on Friday post market close, capital goods segment grew at a dismal 1.8 percent in May compared with 6.8 percent in April, an indication that revival in investments has been inconsistant.
This lends credence to the belief that presently these projects are isolated and confined to specific companies,” said rating agency CARE in a note last week.
Amid concerns of a slow pick-up in projects, investors seemed to be trimming their exposure to some of the listed companies which had sizzled in past one month on hopes of continuing revival in the segment.
While the benchmark Sensex was almost flat with a positive bias, the BSE Capital Goods index was down 0.6 percent at 18,317.96.
At 10.25 am, shares of engineering & construction major L&T fell 1.2 percent to Rs 1,848.45, BHEL also declined 1.2 percent to Rs 265.60, Kalpatru Power eased 0.7 percent to Rs 269.70 and Suzlon Energy was down 0.2 percent at Rs 23.15. Others such as Havells India, Bharat Electronics and Sadbhav Engineering were trading a tad lower. Several of the stocks in the capital goods space clocked significant gains in the past one month, with the BSE Capital Goods Index surging nearly 9 percent as against 3 percent rise in the benchmark Sensex.
ET Now 12th Aug 2015 : Q&A on Metal Stocks
A few argument started to come about may be looking from a really long term perspective at the commodity plays, NMDC 100, so much of cash on the books, dividend yield of 8 per cent or 6 per cent or 5 per cent as the case may be depending on what you believe will do, these arguments have been thrown out of the window by some of the crashes that have happened in the last one month. At every level people have come in and said let us go out and buy some of these names with a two year-three year perspective and then the stocks have become cheaper by 10-15 per cent they are at fresh 52-week lows or life lows as the case may be right now. What would your advice be to people who are listening in the conversation right now and wondering whether or not to buy into some of the metal names? Daljeet Singh Kohli: There are two ways of buying metal stocks, one way is that you buy them as a contrarian when everything is going wrong for them and when you buy you have to wait that it might go down further 10 per cent after your purchase. Additionally, in that case you have to have a very long patient period of investment where you will not know when this cycle will turnaround. Therefore, you have to stay with it and know that I have taken something at Rs 100 but before it moves to 100 plus it will first probably go to 55 or 60; therefore, if you are prepared mentally then only you do this. The other way is that when this commodity cycle turns around, at the time of inflection, at that time if you buy then the patience is much lesser, then the holding period requirement is much lesser and you get a faster appreciation. How will you know when that time has come, that time will come when you will get all the positive news on the sector flowing in. Right now it is only on the negative news which is flowing in. Both the ways are correct, there is nothing wrong in any of these ways; it depends upon your appetite and which way you want to go. Normally, what we advice our clients, because they do not have too much of patience, is that the commodity cycle normally will take three to five years to turnaround, and the bull period will be much shorter than the bear period. Therefore, you have to be very very clear when to get out of it. Therefore, the best way to do this is when they are running, at that time you latch on to the momentum and and stay with that momentum, and move out. Therefore, I always say that commodities are a trading play, more of a trading play and less of an opportunistic play, less of an investment or portfolio investment stocks.
18th Aug 2015 : Agri
In a chat with ET Now, Mayuresh Joshi, Fund Manager, Angel Broking, shares his views on the agri space.
ET Now: A host of experts believe that the agri theme is making a comeback. What according to your mind is working for the agricultural sector right now? Which agri stocks could be good buying bets in the next 12 months?
Agri Chem: Something like United PhosphorusBSE 1.01 % is what we liked a few quarters back. It has moved up substantially. Chemical companies too are dependent on a lot of macro and micro data.
Seed :For example, seed companies are clearly struggling with the monsoon not expected to come through at least for this year.As pre-buying takes place before monsoon season begins, the possibility of lower seed sales coming through is not ruled out.
Others :For all other agri players, one really needs to understand how growth dynamics are panning out.Companies like Jain IrrigationBSE 3.05 %, though the management is very hopeful of debt-equity ratio coming down, one really needs to understand how their micro irrigation system business is shaping up. The receivables from governments have come down substantially and there is lack of clarity on stake sale food processing unit. Therefore, a lot of these aspects need to be looked at. There is no definitive buy call still on these food stocks yet.
Indian companies benefited by fall in crude prices
Although fall in crude oil prices benefits the entire economy, let's take a closer look at some sectors and stocks which will be directly boosted:
However, investors need to be careful while analysing this broad segment and the most important factor is to see whether these companies are catering to the retail consumers (b2c) or to other industries (b2b).
Since most of the players here are following the b2c model, paint companies should be able to show significant net profit growth in the coming years if crude prices remain low.
Though the raw material costs will start to come down, paint companies have not yet started cutting prices and there will be a major margin jump due to this. Though there may be some price cuts in future, most experts believe that they will keep a portion of this benefit to themselves.
Asian Paints, the biggest player and also more clued to the b2c model, will be the main beneficiary from h ..
Tyres companies: (Apollo Tyres, MRF, Ceat and JK Tyres) Increased automobile usage due to lower petrol and diesel prices should increase demand for tyres in the replacement segment. Synthetic rubber can be produced from petroleum waste and price of natural rubber, its main raw material, is also linked to crude oil prices. Also, the companies will benefit from higher margins as 30-40 per cent of their raw material costs are linked to crude oil prices.
Automobiles: (Maruti Suzuki, Hero MotoCorp etc.)
The benefit to this sector will come in the form of increased demand due to fall in fuel prices.
FMCG:
The FMCG sector will also benefit from low crude prices. Petroleum derivatives form the raw material for packaging items such as tubes, bottles and covers. Petroleum derivatives are also used in diapers, detergents, shampoos, cosmetics and perfumes.
Airlines: (Jet Airways, SpiceJet)
Fuel accounts for 34-46% of total expenditure of airline companies. For every $10 fall in crude oil, airline companies save close to 5 per cent of expenses. So, a benign crude oil along with rising passenger traffic, which has been growing by close to 20% for the past few months, should boost earnings of airlines companies.
Lubricants:
Crude oil forms 56 per cent of the raw materials required to produce lubricants. This should reduce the production costs for the lubricant companies. This should lead to operating margin expansion for lubricant companies in the coming quarters.
Possbile Delisting Candidates are a good investment Idea
Uncertain times call for retail investors to adopt defensive strategies. It is important to focus more on avoiding capital erosion now, rather than looking at spectacular returns. Investors should look for potential delisting candidates -fundamentally strong scrips that won't fall too much in a weak market, but offer potential for opportunistic gains. Some recent examples demonstrate how investors stand to gain even in times of economic uncertainty when companies decide to buy back their own shares in a bid to voluntarily delist. UTV Software, Alfa Laval, Carol Info, Patni Computers and Ineos ABS have all generated hefty returns for longterm investors defying the overall market weakness in the second half of 2011.
Is it possible to predict delisting candidates? Delisting shares from the stock exchanges is a unique decision in a company's life. And it is almost impossible to forecast. These decisions depend greatly on the owners and management and their way of thinking. At least, one can't predict the timing of a delisting offer. We at the ET Intelligence Group have therefore put together a group of companies with certain common parameters that make them more likely to opt for delisting than others. These are MNC associates with parent companies operating overseas. Secondly, and most importantly, the promoters hold more than 80% in the Indian arms. Thirdly, they don't need to raise capital in India. Or, in other words, being listed in India doesn't serve them much purpose. With market regulator Sebi or the Securities and Exchange Board of India mandating that all listed companies have to increase public shareholding to a minimum 25% by June 2013, these companies have to take a conscious call sooner or later on whether to reduce promoter holding or go for delisting.
Why MNCs are more likely to delist Compared to domestic companies MNC associates in India are more likely to choose to delist when faced with the dilemma of whether to dilute promoter stake to meet local regulations or delist. Most of these companies were listed in India not due to a need to raise capital, but more to meet the then prevailing FDI norms. For such companies complying with the cumbersome and timeconsuming rules and regulations of Sebi and the stock exchanges makes little sense. Be it fund raising or M&As, any major decision takes substantial time for a listed company compared to an unlisted one. Finally, the current depressed market conditions offer an ideal opportunity to delist. This is not to say MNCs are the only delisting candidates. In fact, over a period of time a number of unexpected Indian companies such as Nirma and Binani Cements have gone ahead with delisting processes. In a number of cases, acquisition by a foreign player has proved a prelude to delisting. For example, Sparsh BPO. However, MNCs are the more predictable candidates.
3-6-2015
Rate-sensitives, debt-laden cos tank on waning prospects of more rate cuts
High beta and highly-leveraged companies which have earlier surged on hopes that sustained rate cut would help these companies to improve their balance sheets are now getting dumped.
Shares of Unitech plunged 50 per cent intraday and the fall could extend as the session progresses. Shares of Jaypee Group companies such as Jaiprakash Associates, Jaypee Power and Jaypee Infratech are witnessing sharp sell-off on huge volumes.
Jaiprakash Associates plunged 29.17 per cent, Jaypee Infratech tanked 15.94 per cent and Jaiprakash Power fell 24.89 per cent intraday.
Infrastructure stocks like Punj LloydBSE -7.93 % was down 10.23 per cent, Lanco Infratech tanked 14.62 per cent, Era Infra EngineeringBSE -10.00 % fell 9.64 per cent and IRB Infra was 6.99 per cent lower.
According to Sudip Bandyopadhyay of Destimoney Securities, certain lenders to leveraged companies are selling stocks in the market and borrowers are unable to do much.
The Reserve Bank of India has said the policy will continue to be data-contingent and rate cut will be possible only if monsoon is normal and inflation is under control. The hawkish view dampened market sentiment and analysts are of the view there may not be any rate cut for rest of the year.
Understanding the Oil companies
ONGC, Oil India, and GAIL are upstream oil companies and IOCL, BPCL and HPCL are down stream oil companies.
The under recoveries of down stream companies are compensate by Government subsidy in part and absorption by upstream companies in part.
In 2011-12, IOC received Rs 45,486 crore from Government and another Rs 29,961 crore from upstream oil companies.With that for the full fiscal 2011-12, IOC reported net profit of Rs 3,955 crore against Rs 7,445 crore in 2010-11.
Impact of Politics on share prices
May 2007 : Amidst widening rift between DMK leaders and Mr Dayanidhi Maran,Sun TV’s Rs 10 paid up share price on BSE dropped 3.62% on Tuesday to Rs 1478.90 on top of a 4.31% drop on Monday, even while Sensex dropped 0.26% on Tuesday .Sun TV has been operating from the campus of DMK’s party headquarters right from the beginning. It would be shifted soon, according to people familiar with the developments.
Meanwhile, the share prices of a rival channel Raj TV jumped 20% to Rs 226.40 a share on Tuesday. It also attracted an upper freeze of 20% with only buyers in queue. When Mr Karunanidhi celebrated his 50th year in assembly last Friday, the grand function, attended by political leaders including Sonia Gandhi and Prime Minister Manmohan Singh, was telecast live by Raj TV. Such events were purely in the domain of Sun TV earlier. This has led to two sets of speculations. One is that Raj TV prices are going up on the back of support by DMK. Another is that, Sun TV itself could be pitching for Raj TV.
Stock market reactions to election results -even state elections !!!
We have seen that stocks move up or down based on central elections.Go through the below to understand how stocks reacted to state elections as per report of The financial Express-May 2007
It is hard times for those who may have flourished in Raj Mulayam. It may also alter the ambitious business plans of some leading members of corporate India including the Reliance-Anil Dhirubhai Ambani Group (R-ADAG), sugar baron Kushagra Bajaj, Sahara India, Ansal Properties and Infrastructure (APIL), Flex and HFCL. Then, there are the obvious gainers such as infrastructure major Jaypee Group. Under the Mulayam Singh regime, R-ADAG company RNRL bagged the ambitious Rs 10,000-crore power project in Dadri in 2004. The 3,500 mega watt (mw) plant is pegged to be the world’s largest gas-based power project. Another group company, Reliance Energy (REL), is setting up a 600-mw coal-based power project in Shahjahanpur. In fact, the company had even signed a Power Purchase Agreement (PPA) with the Uttar Pradesh Power Corporation for the project. With interests in the roadways sector, REL was also likely to bid for a couple of expressways in the state.
Things could change now, with Mayawati all set to assume power in the next couple of days. She has been one of the most vocal opponents of the Dadri project, alleging a major land scam in the process against UPSIDC chairman Amar Singh. The REL share price went down from Rs 514.90 on Thursday to Rs 508.70 on Friday, though the RNRL scrip rose from Rs 27.05 on Thursday to Rs 28.25 on Friday. Another prominent industrial house to have made hay in Mulayam Singh Yadav’s heydays was Bajaj Hindusthan. Its MD Kushagra Bajaj leveraged his proximity with Amar Singh to acquire the Pratappur Sugar Mills in eastern UP and was the prime contender to buy all the 24 state-owned sugar mills put up for sale by the UP government. Despite being on the block for more than two years, the sale has not materialised, in the wake of political opposition from Mayawati and others. Mr Bajaj has earlier been in Mayawati’s line of fire in 2004, following acquisition of over 200-acre agricultural land in Meerut for construction of a 7,000-tcd (tonnes crushed per day) sugar mill.
APIL-owned Ansal IT City & Parks’ bagging a 30-hectare IT SEZ in Greater Noida last year sparked off a land grab debate by Mayawati. APIL chairman Sushil Ansal’s proximity to Amar Singh is not new and the company is developing large-scale commercial and residential real estate projects in various parts of the state. Sources active in UP politics say Thursday’s raids on UFlex and HFCL need to be seen as an indication of things to come. Both UFlex chairman Ashok Chaturvedi and HFCL’s Vinay Maloo are known to be Amar Singh’s close associates and have huge business interests in UP. Together, Amar Singh and Mr Maloo also own an oil company, Ensearch. Of the prominent industrialists in the Amar Singh camp, Sahara India chief Subrata Roy seems to have played the safest game. The company plans to develop over half-a-dozen integrated townships in various cities of the state. According to sources, for the last 7-8 months, Mr Roy has been going slow in his relationship with Amar Singh. In March this year, Mr Roy had met Congress president Sonia Gandhi. While the HFCL share price remained flat on Friday, UFlex price closed at Rs 144.25 on Friday, as compared to Rs 151.80 on Thursday. On the gainers’ side, it is the integrated infrastructure conglomerate Jaypee Group that looks most likely to gain, if the past is any indication. The group had bagged the Rs 6,000-crore Taj expressway project during Mayawati’s previous regime, which was the biggest project awarded by it. The Jaypee Associates scrip closed at Rs 609.75 on Friday, up from Rs 576.40 on Thursday. The country’s largest industrial house, Reliance Industries, has also been keeping close tabs on the elections. RIL will have a huge dependence on the UP government once the company starts large scale agri-sourcing for its retail venture from the state. Following the split in the Ambani family, Mukesh Ambani ended up with sour relations with Mulayam Singh and Amar Singh.
FMCG sector stocks rallying ahead of times : BUY, HOLD OR EXIT?
For a sector that stood tall even during the dark market days after the 2008 financial crisis, and has continued to do well since, the current caution on the Street seems unfair. A closer look, and the gloom seems justified. Valuations of fast moving consumer goods, or FMCG, stocks have run up quite a bit and it may be time for a correction, say experts.
The sector is considered defensive, which means its stocks are in high demand when the markets are falling. The reason is simple. Irrespective of how the economy is performing, the demand for consumer goods, daily necessities like food and toothpastes, remains stable. During difficult times, people will reduce spending on discretionary items such as cars and air-conditioners but continue to buy basic essentials. This has held true since the 2008 crisis. But now, as other sectors revive , FMCG may not remain everyone's favourite.
LOOKING BACK
FMCG stock indices have been performing quite well with CNX FMCG index on the National Stock Exchange returning 28.94% and the Bombay Stock Exchange FMCG index rising 27.26% in the one year to 26 April 2013. Funds such as ICICI Prudential FMCG Fund and SBI FMCG Fund returned 18.08% and 26.75%, respectively, during the period. But will this rally continue?
"Most FMCG companies have discounted the 2014-15 numbers without confirmation of volume growth. The FMCG sector in India is well-poised, but you may see some negative surprises," says Sachin Bobade, FMCG analyst, BRICS Securities. Analysts say stocks in the sector are trading higher than historical valuations. Sustaining these will be a challenge. Expansion will be difficult, and the biggest risk is the price to earnings, or PE, ratio going down. The ratio, used to value a stock, measures how much the market is willing to pay for it compared to the company's earnings.
To understand why these high valuations might not be sustainable, we need to see why the sector has been in such high demand in the last few years. The main reason, say analysts, is high government spending, which been acting as a stimulus. Also, there are not too many sectors growing as fast as the FMCG sector.
"Government policies that have been positive for demand and strong economic activity until last year helped earnings of FMCG companies. Plus, there was demand for defensive stocks due to weakness in investment expenditure," says Ritwik Rai, FMCG analyst, Kotak Securities.
Another godsend has been falling commodity prices. For instance, in the January-March quarter, FMCG companies did well due to lower input costs. "Most FMCG companies that we track performed reasonably well in the last quarter despite the slowdown due to fall in input costs. This expanded operating margins. However, companies had to increase advertising and promotion spends to revive volume growth," says V Srinivasan, FMCG analyst, Angel Broking.
However, this has a flip side too. Lower raw material prices have given rise to competition from unorganised FMCG companies. This is because as raw material prices rise, companies in the unorganised space are unable to control costs due to lack of scale. When raw material prices fall, they make a comeback.
The government stimulus, too, may be running out. "Given that the government's ability to manoeuvre consumer demand is curtailed by fiscal deficit concerns, and sales are beginning to soften following inflation and weak income growth, the risks to earnings growth are rising," says Rai of Kotak Securities.
FUTURE MAP
Sustaining the present higher valuations will be challenging for FMCG companies. Also, the current base is high and so demand growth is not likely to be as high as in the recent quarters, say analysts.
Recently, valuations have been supported by promoters buying additional shares from the market. For instance, Hindustan Unilver's (HUL's) parent Unilever Plc wants to buy a 22.52% stake in the Indian unit at Rs 600 per share. The market price of the stock was Rs 595 on 13 June 2013. After the open offer, Unilever will hold 75% in the company. Similarly, in February, GlaxoSmithKline Plc increased stake in its Indian arm, GlaxoSmithKline Consumer Healthcare, from 42.3% to 72.5%. The deal, at Rs 3,900 a share, was valued at Rs 4,800 crore; the parent said it was part of a strategy to invest in the world's fastest growing market. These two deals have put further upward pressure on valuations of Indian FMCG companies, say analysts.
In addition, higher competition amid softening demand may weigh on profitability. "Competitive intensity could rise in a weakening environment as companies concentrate on volume gains, weakening profit growth further," says Rai of Kotak.
However, analysts are quick to point out that the growth will be not be bad overall, as India is still a low consumption country. It's just that the sharp rally over the last few years has made these stocks very expensive, they say. "Volume growth will stabilise and margins will expand, but not to the extent that we saw in 2012,"says Bobade of BRICS Securities.
BUY, HOLD OR EXIT?
While analysts are not denying that the sector will continue to grow, many say it's time to book profit and not invest. "We believe the FMCG sector as a whole is trading at fair valuations and hence have 'neutral' rating on the sector," says Srinivasan of Angel Broking. Others say the sector may start yielding negative surprises and hence it's a good time to reduce exposure. "Weakening profit growth due to competition could lead to de-rating. Therefore, there is significant risk that FMCG stocks, on an average, could yield negative returns in the next year or so," says Rai of Kotak.
"I think one should reduce exposure to the FMCG sector. The valuations are very high. There is risk that the rally will continue due to demand for defensive stocks, but there will be some correction going forward," says Bobade of BRICS.
While analysts do not deny that the volumes will keep growing, they are not bullish on FMCG funds. A complete exit is also not advisable due to the inherent stability of demand for FMCG goods. However, if you have a horizon of more than five years, you can hold your investments. But any fresh exposure is a NO.
The Infra Bust like the dotcom bust ..a good story...that was overbought....In the runup..spoiled the industry itself which kept on building order book to please capital markets....adverse effects of playing to the gallery
If you are fretting that your stocks have not yielded any gains since the 2008 crash, here's some cold comfort. A study byET Wealthshows that the 10 biggest wealth destroyers have lost 75-98% of their value since January 2008. Their combined marketcapitalisation, or the value of the total number of shares, dropped 87% fromRs7,89,597croreon 8 January 2008 toRs1,03,038croreon 8 August 2013.
These 10 stocks are not obscure, smallcap scrips, but widely held large- and midcap companies. At least three of them—DLF, Bhel and JP Associates—are constituents of the 50-share benchmark, Nifty. Others find a place in broader market indices or sectoral benchmarks. The losses have been mindboggling. After the dotcom bubble burst, the market capitalisation of all the companies listed on the BSE declined by Rs 5,88,402 crore, dropping from Rs 10,45,965 crore in February 2000 to Rs 4,57,563 crore in September 2001. However, these 10 stocks alone have exceeded that figure, losing Rs 6,86,559 crore since January 2008.
The usual suspects
Most of these wealth destroyers are from the real estate, infrastructure and capital goods sectors. All three sectors have been battered in the past five years. The CNX Real Estate index fell 85%, while the CNX Infrastructure index dropped 66% between 8 January 2008 and 8 August 2013.
Real estate developerDLFhas been the biggest wealth destroyer, with a drop of Rs 1,71,590 crore in its market capitalisation. This loss is more than the total market capitalisation of software giant,InfosysThe drop in the value ofReliance Communicationssurpasses the total market capitalisation of its biggest rival,Bharti Airtel.The combined losses of Bhel andUnitechare big enough to buy the five biggest PSU banks, including theSBI,Bank of Baroda,PNB,Canara BankandBank of India.
However, many investors have not reacted to this wealth erosion because it has happened gradually over five painful years. In the interim, shares must have changed hands, and very few of the investors who owned these shares in January 2008 would still be holding them. For some, there was an opportunity to exit in 2010, when the markets were upbeat, and again, early this year.
Given this massive decline, should you buy these stocks? As our cover story argues, just because a stock is trading at a historical low does not make it a good buy.
Promoters the biggest losers
To be fair, individual investors did not bear the brunt of this huge erosion in value. The company promoters, who controlled the largest chunk of the equity, were the biggest losers. Tata Communications, for instance, saw its capitalisation drop by Rs 15,235 crore, but the loss to individual investors was only Rs 341 crore. However, in the case of some other companies, such as IVRCL, which is not in the top 10 wealth destroyers, the promoters held less than 10% of the total equity.
The company lost Rs 6,658 crore of market capitalisation, but the bulk of this loss (Rs 5,516 crore) was borne by institutional investors, including FIIs, mutual funds, insurance companies and banks. They accounted for 22% of the total loss of market capitalisation, while individual investors lost around 5.5%. However, some of the losses of institutional investors are actually those of small investors in mutual funds, Ulips and pension plans.
Avoiding losses
Could these losses have been avoided? While the promoters had little option, individual investors could have taken steps to minimise them. For one, it is always advisable to set a limit to the loss you are willing to take. Small investors tend to sell their winners too early, but hold on to losers for far too long. This is what happened in case of realty stocks, where investors clung on to their investments in the vain hope that they would recoup their losses some day. However, the real estate stocks just kept plunging to new depths and the losses kept piling. The lesson for investors is not to get emotionally attached to a certain price level. Learn to cut your losses and exit if the tide has turned.
A bigger learning is to stay away from momentum stocks. At the height of the irrational exuberance of 2007, infrastructure was a buzzword for mega gains. Investors were blindly putting money in infrastructure stocks without assessing the sector's potential or checking valuations. This herd mentality should be avoided at all cost. Don't buy a stock just because everyone else is doing so. Invest only after careful research and evaluation of the company's financials. The real estate sector is a prime example of how valuations can be easily inflated.
Diversify your investments, not only across sectors and stocks, but also across time. Equity mutual funds are a readymade solution for such diversification. They invest in a basket of 25-30 stocks across 7-8 sectors, cushioning the investment against a possible downturn in a stock or sector. The SIP is a diversification across time and should be used to bring down the average purchase price.If you are fretting that your stocks have not yielded any gains since the 2008 crash, here's some cold comfort. A study by ET Wealth shows that the 10 biggest wealth destroyers have lost 75-98% of their value since January 2008. Their combined marketcapitalisation, or the value of the total number of shares, dropped 87% from Rs 7,89,597crore on 8 January 2008 to Rs 1,03,038crore on 8 August 2013.
These 10 stocks are not obscure, smallcap scrips, but widely held large- and midcap companies. At least three of them—DLF, Bhel and JP Associates—are constituents of the 50-share benchmark, Nifty. Others find a place in broader market indices or sectoral benchmarks. The losses have been mindboggling. After the dotcom bubble burst, the market capitalisation of all the companies listed on the BSE declined by Rs 5,88,402 crore, dropping from Rs 10,45,965 crore in February 2000 to Rs 4,57,563 crore in September 2001. However, these 10 stocks alone have exceeded that figure, losing Rs 6,86,559 crore since January 2008.
The usual suspects
Most of these wealth destroyers are from the real estate, infrastructure and capital goods sectors. All three sectors have been battered in the past five years. The CNX Real Estate index fell 85%, while the CNX Infrastructure index dropped 66% between 8 January 2008 and 8 August 2013.
Real estate developer DLF has been the biggest wealth destroyer, with a drop of Rs 1,71,590 crore in its market capitalisation. This loss is more than the total market capitalisation of software giant, InfosysThe drop in the value of Reliance Communications surpasses the total market capitalisation of its biggest rival,Bharti Airtel.The combined losses of Bhel and Unitech are big enough to buy the five biggest PSU banks, including the SBI, Bank of Baroda,PNB, Canara Bank and Bank of India.
However, many investors have not reacted to this wealth erosion because it has happened gradually over five painful years. In the interim, shares must have changed hands, and very few of the investors who owned these shares in January 2008 would still be holding them. For some, there was an opportunity to exit in 2010, when the markets were upbeat, and again, early this year.
Given this massive decline, should you buy these stocks? As our cover story argues, just because a stock is trading at a historical low does not make it a good buy.
Promoters the biggest losers
To be fair, individual investors did not bear the brunt of this huge erosion in value. The company promoters, who controlled the largest chunk of the equity, were the biggest losers. Tata Communications, for instance, saw its capitalisation drop by Rs 15,235 crore, but the loss to individual investors was only Rs 341 crore. However, in the case of some other companies, such as IVRCL, which is not in the top 10 wealth destroyers, the promoters held less than 10% of the total equity.
The company lost Rs 6,658 crore of market capitalisation, but the bulk of this loss (Rs 5,516 crore) was borne by institutional investors, including FIIs, mutual funds, insurance companies and banks. They accounted for 22% of the total loss of market capitalisation, while individual investors lost around 5.5%. However, some of the losses of institutional investors are actually those of small investors in mutual funds, Ulips and pension plans.
Avoiding losses
Could these losses have been avoided? While the promoters had little option, individual investors could have taken steps to minimise them. For one, it is always advisable to set a limit to the loss you are willing to take. Small investors tend to sell their winners too early, but hold on to losers for far too long. This is what happened in case of realty stocks, where investors clung on to their investments in the vain hope that they would recoup their losses some day. However, the real estate stocks just kept plunging to new depths and the losses kept piling. The lesson for investors is not to get emotionally attached to a certain price level. Learn to cut your losses and exit if the tide has turned.
A bigger learning is to stay away from momentum stocks. At the height of the irrational exuberance of 2007, infrastructure was a buzzword for mega gains. Investors were blindly putting money in infrastructure stocks without assessing the sector's potential or checking valuations. This herd mentality should be avoided at all cost. Don't buy a stock just because everyone else is doing so. Invest only after careful research and evaluation of the company's financials. The real estate sector is a prime example of how valuations can be easily inflated.
Diversify your investments, not only across sectors and stocks, but also across time. Equity mutual funds are a readymade solution for such diversification. They invest in a basket of 25-30 stocks across 7-8 sectors, cushioning the investment against a possible downturn in a stock or sector. The SIP is a diversification across time and should be used to bring down the average purchase price.
Top performers for 2015
Stocks that have fallen down and not recovered while market has fallen and recovered between 2008 and 2013
Feb 2016 to may 2017 various world markets
price rigging by derivatives/structured product holders
April 2010 Goenka reportedly put together a plan to manipulate and secure the closing prices of GDRs of two companies, the Russian oil and gas giant Gazprom and Reliance's Industries. (Incidentally, a GDR or a global depository receipt is a financial instrument through which money can be raised globally by a company through issuance of bank certificates in one country and against shares in a foreign company.) In April 2010, Carrimjee introduced Goenka to Vandana Parikh or 'broker B' (as named in the FCA's Decision Notice) and a series of conference calls took place. Carrimjee had apparently known Parikh for close to 10 years and his firm, Somerset, had an account with the brokerage firm, Schweder Miller. Targetting the GDRs of Gazprom first, Goenka wanted to know if the closing price of the company's GDRs could be raised by placing strategic orders – he explored the steps necessary for increasing the closing price and the latest time at which an order could be placed. Parikh explained the closing auction process, specifically the likely price movements that could result from placing orders of various sizes. They also agreed on some trial runs. (See Decision Notice of the FCA in UK in the attachment.) The plan by Goenka, Parikh, Davis and Carrimjee to allegedly rig the prices of GDRs issued by Gazprom had to be dropped after Vladimir Putin (the then Prime Minister of Russia) announced a proposal to merge Gazprom and Ukranian gas major Naftogaz, which drove down the share prices of the Russian company. Goenka, it seems, used the information gained from this exposure later in the year in October and successfully manipulated the closing price of Reliance shares, saving some $3.1 million on a structured product he held. The 'final notice' by the FCA to Goenka dated 17 October 2011 revealed that he had bought close to 770,000 GDRs of Reliance, whose prices had gone up artificially by around 1.7 percent above the 'knock-in price', a few moments before the closing bell was rung to announce the end of trading that day.
From a maths teacher to India's
leading option seller: The inspiring journey of PR Sundar
Moneycontrol
News - Shishir
Asthana -12TH AUG 2018
From a
person who managed to lay hands on his first pair of slippers when he reached
the 10th grade to be one of the largest individual option sellers in the
country is an inspiring journey. The fact that the person was a teacher for the
most part of his life makes one wonder about the hidden potential of this
individual.
PR
Sundar, a math teacher, learned about options from the most basic source -
the stock exchange booklet - that every dealer working in a broker’s office
reads. He still maintains that the book is his primary source of knowledge.
While the source of information was the same, the knowledge that Sundar could
extract from that source was much higher than what most are capable of.
Born in
a poor family, Sundar, a post graduate in mathematics, took to teaching as
there were few job opportunities back then. A teaching assignment in Singapore
helped him save capital to think about returning back to India and starting a
business. A strange happenstance brought Sundar to the market and he has never
looked back.
A
successful trader who earned his spurs in the options market, Sundar continues
to teach, only this time the subject has changed to options. But like every
good teacher he is more interested in clearing the cobwebs and imparting
knowledge, which can remain lifelong, than spoon-feeding strategies.
Edited excerpts from his interview with
Moneycontrol, where he speaks about his journey and what it takes to be an
option seller.
Q: How did a math teacher end up trading
options? A: After my post-graduation in mathematics from Chennai, I
bagged a job as a maths teacher in a school in Gujarat as there were few jobs
in south India then. Among the many good things that Gujarat has to offer, one
is the interest in share markets and investing, which stuck with me. Since
markets are about numbers, I was naturally attracted towards it.
I
received an opportunity to work as a maths teacher in Singapore and moved there
in 1993. After a 12 year stint in Singapore, I returned back to India with some
capital to start a business. I was looking out for an alternate career other
than teaching.
By a
fortunate coincidence a relative, who was a sub-broker asked me to appear for
the NSE Academy Certification in Financial Management (NCFM) exam so that he could
use the certificate to operate his terminal. It was while studying for this
exam that I really got interested in options.
What
also made me opt for trading was that everyone used to say that 95 percent of
all traders lose money. This was a big opportunity to me as few other
businesses offer such a skewed playing field. All one needed to know was what
the other 5 percent was doing and follow it religiously.
But
like most others, my entry into the market was through the cash market. I found
the cash market offered very low trading returns, so I moved to the futures
market. The problem here was that the risk was high. I wanted an instrument
where the risk was low and the reward high. Options offered me the perfect
playground.
The
good thing about options was that it gave one the option to choose the perfect
mix between risk and reward according to one’s liking. Option selling is like
sitting in front of a bonfire. If you are too close, you can get burnt. If you
are sitting too far, then you will not enjoy the warmth. You need to sit at the
right distance from the fire.
Similarly,
in options, if you are trading a strike price which is too far away from the
current price, the reward will be low as will the risk. If you are trading
close to the market price, then the risk will be higher. It is this flexibility
that options offer and the probability of success is what attracted me to them.
Q: While trading options were you always a
seller?
A: I have been an option seller from the beginning. Option selling is like
running an insurance company. An insurance company sells protection to many
people, but only in a few cases does it have to pay claims as fewer people die.
It provides for a catastrophe by taking a re-insurance cover. I buy an option
only in case the strategy needs to be insured or what in market parlance is
known as hedged.
Coincidentally,
my journey in options started with some important market reforms. Prior to
2007, it was very costly to sell options. Brokerages were high and Security
Transaction Tax (STT) was calculated on the entire contract amount. Only when
the STT calculation was based on premium value and brokerage cost was reduced
with the advent of online brokerages did option selling become remunerative.
I write
options aggressively even if they are priced at Rs 1 and make Rs 4-5 lakh a
week. This opportunity was not there in 2007-08 as the cost of doing business
was high.
Q: Did having a maths background make it
easier for you to get through the math involved in option pricing?
A: The only book I read in options was that provided by the National Stock
Exchange to clear NCFM. I have a clear idea of what the option Greeks stand
for, but I rarely use it in my decision making. The market price of the option
determines the Greeks value and not the other way round.
Q: Do you use technical charts or fundamental
inputs in your trading? A: In order to be
successful trader you need two things: edge and hedge. Edge is your market view
and hedge comes into play when your edge is not working out. I am a jack of all
and master of none. I look at everything, technical charts and all kind of data
before taking a view on the market.
Based
on these inputs, I take a view on the market and my position. At most times,
the view goes wrong and that’s where hedging comes into play.
Q: How is your teaching background helping you
in trading? A: In trading as well as in any business or profession what is
needed to succeed is logical thinking. Being a student and teacher of math,
logical thinking comes with the job. In trading, education has little role.
Even a highly educated person fails to be a trader, while a barely educated
person can be very successful.
Q: What option selling strategies do you
deploy? A: I mainly trade in index options. Around 95 percent of my
trades are in the Nifty and Bank Nifty. I start out by looking at all data
points pertaining to the market like institution flows, call-put data and open
interest. I then form a view after glancing at the charts. It is only after
that do I decide on the strategy to choose.
I
normally take low-risk trades, so I like to opt for a short strangle, iron
condor, short straddle or butterfly strategy. My success is not based on my
view or strategy, it is how I manage the trade even when the view is wrong.
Everyone has the knowhow of risk management strategies, but not everybody is
successful. What separates us is the way in which I handle the trade,
especially a losing position.
I
divide our trade into 5-6 components and invest in 5-6 strategies. Around 60
percent of my capital is deployed this way and the remaining 40 percent is for
fire-fighting.
In
Nifty alone, I may have multiple strategies at play at any time. Apart from the
strategies, I also trade various expiry contracts. I may have a Nifty position
in the current month, next month, far month, six months contract and even a
one-year contract. In the case of Bank Nifty, it will be weekly and then
monthly contracts.
Each
expiry contract will be taken to capitalise the opportunity at that particular
time series. The longer-term contract like the yearly or six-month contract do
not need too much management, it’s the smaller period where we manage very
aggressively.
Q: Since the key to your success is managing
the trade, how do you salvage a position that is against your initial
assumption? A: There are four ways in which one can manage a position.
First,
if we have a short straddle trade and the market has moved violently against my
position after a few days of initiating the trade, then the chances are that I
may be in profit on account of time decay. I can simply square of this trade
and build a new position. But if the volatility has increased in a very short
time, then one can adjust the trade by shifting the contract around where the
market is trading.
The
second way is to average the position by adding a new position around the
market price. The third way is to add a futures position in line with the
market direction. The fourth way is to exit by taking a loss.
In my
case, most of the time the trade management and hedging works. Only
occasionally do I get a trade like a black swan event which hits me badly. Like
the November 8, demonetisation trade, where the market opened with a big gap
down and started recovering immediately. Our assumption was that it would keep
on going lower. Such days give us a loss which takes away 2-3 months of
profits, but we are okay with it and factor in such days in our trading. Such
trades are rare but one needs to be mentally prepared for it.
Q: You have a very aggressive expiry day
strategy, can you walk us through an expiry day?
A: I do trade intra-day, but on every Thursday, which is the expiry day for
Bank Nifty contracts, I trade very aggressively. On a good day, I end up
trading one lakh lots. Every Thursday, I trade in the Bank Nifty and on the
last Thursday of the month, I trade in both the Bank Nifty as well as Nifty.
At the
start of the day, I study the market and start deploying money. At the start, I
deploy around 10 percent of the pre-decided limit and then progressively keep
on adding to that position. Based on the ground condition, I keep on adjusting
my trade. I keep on hedging or shifting my position based on the market’s
movement.
I
deploy all my capital by 2:00 pm. By 2:30-2:45 pm, I either book a profit/loss
or keep a stop-loss on trades. This is because between 3 and 3:30 pm on expiry
day there is a lot of volatility.
Q: Since around 95 percent of your trades are
in index options, where do you trade with the remaining five percent?
A: I use profits from the trade to buy shares in frontline index-based stocks.
Occasionally, the price movement between shares and options offers a good
trading opportunity. Also, frontline stocks can be used as limit with the
broker. At the same time, one can enjoy the benefit of price rise and
dividends.
There
are, however, opportunities in other stock options also. Recently, I purchased
Rural Electrification Corporation, which was trading over Rs 90 per share and
pays a dividend of around Rs 10 per year. I bought the share with the
assumption that even if I earn one percent by selling call options per month, I
would end up earning nearly 20 percent on the position. This return does not
take into account the share price appreciation in REC.
Q: How are the returns in your strategy?
A: That depends on how you define returns. I do not bring in capital. Around 90
percent of my capital is invested in mutual funds and 10 percent in index
constituents. These investments continue to earn and would continue to do so
even if they were not used as margin collateral. I use these investments as
margin to trade options. Thus, one way of looking at it is that the return is
infinity even if it is small as there is no real money involved. But if I were
to use a constant base, my annual returns are over 50 percent.
Q: You have continued with your profession of
teaching, only now you teach traders. What exactly can a trader learn from your
trading classes?
A: My main aim through these classes is to create awareness of option selling
and remove the myth surrounding option selling. The general talk is that option
selling has unlimited risk, but if a trader is buying a future contract at Rs
100 he has that much risk, but a put option seller with a strike price of Rs 80
has lower risk.
The
option buyer is said to operate with limited risk and an opportunity to gain
unlimited reward. But no one talks of the probability of winning as an option
buyer. Option seller, on the other hand, is operating with a very high
probability of winning.
While
an option buyer has to bring in capital to buy, an option seller can use
collateral and need not bring in funds. Further, the seller has the flexibility
of hedge his position using the same collateral, but the buyer will have to
bring in additional capital.
But
option selling is not for a small investor, it requires capital. Anyone can
gamble, but few can run a casino. Moreover, it is the casino that always has
the slight edge.
I teach
traders how option selling can be a good business, provided it is managed like
a business. It is the management of trade that I focus on. I try to drill in
the fact that having a view is fine but one needs to be prepared for any
eventuality, just as one does in any business.
International Market Movements : Subprime, Grexit, Chinese Meltdown ,churning between Emerging markets and Developed markets
Chinese Stock Market Meltdown
Chinese retail investors make up 85% of the market, a far cry from the U.S. where retail investors own less than 30% of equities and make up less than 2% of NYSE trading volume for listed firms in 2009.
Combined with the highest trading frequencies in the world and one of the lowest educational levels, describing China’s market as immature is an understatement. As many readers know, mental irrationality is often cited as the No. 1 cause of poor returns.
Using the opportunity to interview some China market participants, both in Shanghai and elsewhere, here are a few observations of how they think and act — and the potential lessons that await.
Chasing bubbles in China isn’t new
An interesting counterpoint to the bubble awareness is that, frankly, Chinese participants are used to chasing bubbles. Whether a cultural phenomenon or something else, over the last decade there’s been a continual hopping of investment from one big money-making scheme to the next. Whether it was real estate a decade ago, gold half a decade ago or wealth-management products a few years ago, there’s a continual cycle of money rotation into the “hot” investment, with each failing eventually in some way. It’s simply stock’s turn. As one interviewee said: “The Chinese market is not for investing, it’s for gambling.”
Early birds get the worms
This goes completely against most prudent and established norms. While the standard advice is to avoid “hot” bubbly assets, in China the experience has actually been to jump in early and fully instead. Many of the bubbles or “hot” investments mentioned earlier have in truth made many of the people I’ve talked to a lot of money. China real estate today is a poor investment but those who got in early doubled or tripled their investments. Similarly with wealth-management products, more people have benefited from their high-interest-rate payouts than have suffered. While the Shanghai market has dropped 20%-30% from its peak a few weeks ago, it still represents a 100% gain from a year ago and a 30% gain over the last 6 months. Those participants who jumped in early are still more than happy.
Greed is king
Despite recognizing it’s a bubble, almost everyone was still all-in on stocks. Why? Quite simply — greed with a dash of jealously. Seeing constant market gains in the news along with daily sharing and boasting from friends and family getting rich is simply too tempting and thus caution was thrown to the winds. Subsequently, this fueled a massive amount of equity exposure followed by leveraging and margin borrowing to go even more all-in.
But fear is the emperor
The only emotion more powerful than greed is fear. Almost everyone I talked to was still all-in on stocks but everyone had a foot halfway out the door, ready to bolt at the first sign of trouble. While not uniquely a China problem — market drops are almost always more violent than the initial rise — in China, it’s several times more volatile. Look no further than solar-panel firm Hanergy’s Hong Kong listed stock, which lost 47% in one hour, or the numerous days the Shanghai market rose or dropped by 5% or more.
Moral hazard in government rescues is real
During the most chaotic moments of the financial crisis, bailout discussions always raised the specter of moral hazard. While it didn’t play a major role in the subsequent U.S. recovery, moral hazard in China is fast becoming a deep problem. Many market participants I talked to said they were confident in the Chinese government to step in eventually to maintain order and prevent mass panic. They know the government’s legitimacy relies heavily on economic progress and fear any contraction. So far, they’ve been right — the government has announced a never-ending stream of interventions over the last few weeks to stem the selloff and panic, with the latest being the implementation of a half-trillion-yuan fund to purchase stock and shore up the market. Of course, the question is: When does a problem become too big for the government to control?
Maturity takes time
Perhaps the last lesson I took away from my Shanghai experience: Maturity takes time. Just as kids grow from naïve adolescence to rowdy teenage years to eventual maturity, so will China and its market participants. While stocks have been a part of U.S. culture and wealth creation for several generations now, in China this is really the first generation where participants both have the money and the ability to invest in stocks.
Perhaps in another generation, after several years of painful lessons and surprising opportunities, it’ll look completely different.
GREXIT : EXIT OF GREECE FROM EU AND EURO ZONE DUE TO DEFAULT ON LOANS
HOW BIG IS THE ISSUE
GREEK IS A SMALL ISLAND NATION NORTH OF AFRICA, IT IS A PART OF EU (EUROPEAN UNION) WHICH HAS A TOTAL OF 19 COUNTRIES. (MANY OF THEM HIGHLY IN DEBT, EG. ITALY, PORTUGAL, CYPRUS, SPAIN, FRANCE ALL HAVE NEAR OR MORE THAN 100% DEBT TO GDP RATIO - INDIA BY COMPARISON HAS AROUND 67% DEBT TO GDP RATIO)
THIS(JUNE 2015) IS THE THIRD EPISODE OF GREEK LOAN DEFAULT CRISIS, IT HAS HAPPENED TWICE BEFORE. IN MAY 2010 $146 BILLION RESCUE PACKAGE WAS DOLED OUT BY EU AND THEN AGAIN IN OCTOBER 2011 THE BANKS HAD AGREED TO TAKE A 50% LOSS ON THE FACE VALUE OF THEIR GREEK DEBT. AND NOW IN JUNE 2015 GREECE HAS DEFERRED SERIES OF DUE DEBT PAYMENTS UNTIL THE END OF THE MONTH.
THIS WHOLE SAGA BEGAN IN 2008 WHEN THE WALL STREET BUBBLE EXPLODED AND THE GLOBAL FINANCIAL MARKETS WERE GOING INTO A TAILSPIN, IN 2009 GREECE ANNOUNCED THAT IT HAD BEEN UNDERSTATING ITS DEFICIT FIGURES FOR YEARS (BASICALLY THEY WERE COOKING AND DISHING OUT THEIR FINANCIAL FIGURES TO KEEP THE BALL ROLLING) THIS RAISED GLOBAL ALARM BELLS AND SUDDENLY THERE WAS NO ONE TO EXTEND FRESH LOANS AND THE COUNTRY STARTED TO MOVE TOWARDS BANKRUPTCY.
NOW WE ALL UNDERSTAND THAT WHEN A COUNTRY/COMPANY/PERSON GOES BANKRUPT TWO ENTITIES SUFFER, THE POPULATION OF THAT COUNTRY AND THE BANKERS/FIS WHO HAD EXTENDED THE LOANS EARLIER, SO IN AFFECT EVERYONE IS A LOSER AND SO ALL STAKE HOLDERS BY DEFAULT TRY TO SALVAGE WHATEVER THEY CAN. KEEPING THIS IN MIND THE I.M.F., THE EUROPEAN CENTRAL BANK AND THE EUROPEAN COMMISSION CAME TO BAIL OUT GREECE WITH ABOUT 240 BILLION EUROS, BUT THESE BAILOUTS CAME WITH A CONDITION THAT THE GREEK GOVT INCREASE THEIR TAX COLLECTIONS BY SPENDING LESS AND STRICTER/INCREASED TAX COLLECTIONS.
GREECE HAD NO WAY TO DISAGREE, SO NOW WITH HARD TAX POLICIES THE GOVT BECAME POPULAR AND THE GOVT WAS THROWN OUT AND NEW GOVT. TOOK ITS PLACE (OFF-COURSE THE LEFTISTS WON THE ELECTIONS).
WITH NEW LOANS IN PLACE ONE WOULD IMAGINE THAT THE CRISIS WAS SOLVED, BUT WAIT.. NOT YET.. MOST OF THE NEW LOANS WERE USED TO PAYBACK OLD LOANS (REMEMBER THESE ARE SOVEREIGN LOANS) AND ON TOP OF IT THE GREEK GDP REDUCED BY AROUND 25% AND THUS AGAIN THE VICIOUS CYCLE OF LOWER COLLECTIONS, HIGHER EMIS AND NO OR LITTLE MONEY LEFT TO PAY GOVT SALARIES, PUBLIC EXPENDITURE ETC..
SO AGAIN A CRISIS IS SIMMERING AND EVERYONE BLAMING ONE ANOTHER.. THE LENDERS BLAMING GREECE FOR NOT PUTTING IN PLACE POLICIES FOR SPENDING LESS AND COLLECTING MORE AND THE CITIZENS BLAMING GOVT FOR MAKING THEIR LIVES MISERABLE. (ONE CAN IMAGINE THE PLIGHT OF GREEK GOVT BEING CRUSHED BETWEEN TWO WALLS!)
SO WHAT NOW? IF GREECE GOES BANKRUPT OR THE LEFTIST GOVT. DECIDES EXIT EU, EU WOULD BE THROWN IN CHAOS AND THIS WILL SPREAD THROUGHOUT THE WORLD AS FRESH DEBTS WOULD CARRY HIGHER RISK PREMIUMS, IN GENERAL INVESTOR SENTIMENTS WOULD BE CAUTIONS AND CREDIBILITY OF EURO AS A CURRENCY WOULD TAKE A BATTERING.
SO HOW BIG IS IT? LETS FIRSTLY UNDERSTAND THAT GREEK GDP IS A TINY-TINY PART OF GLOBAL ECONOMY AND EVEN IN EU ECONOMY GREECE IS A VERY SMALL PART.
SUBPRIME LENDING CRISIS IN US
WHAT DOES US SUBPRIME ACTUALLY MEAN AND HOW HAS IT IMPACTED THE INDIAN AND WORLD MARKETS.
SUBPRIME LENDING IS A GENERAL TERM THAT REFERS TO THE PRACTICE OF MAKING LOANS TO BORROWERS WHO DO NOT QUALIFY FOR THE BEST MARKET INTEREST RATES DUE TO THEIR DEFICIENT CREDIT HISTORY. SUBPRIME IS RISKY FOR BOTH THE LENDERS AS WELL AS THE BORROWERS. FOR THE LENDERS, IT
BRINGS WITH IT HIGH-RISK INVOLVEMENT, POOR CREDIT HISTORY AND MURKY FINANCIAL SITUATIONS.
WHEREAS FOR THE BORROWERS IT MEANS HIGHER INTEREST RATES. THE ADDITIONAL PERCENTAGE POINTS OF INTEREST OFTEN TRANSLATE TO TENS OF THOUSANDS OF DOLLARS WORTH OF ADDITIONAL INTEREST PAYMENTS OVER THE LIFE OF A LONGER TERM LOAN. STATISTICALLY, MORE THAN 25 PERCENT OF POTENTIAL BORROWERS OF UNITED STATES FALL IN THIS CATEGORY AND HENCE FITTINGLY NEARLY 25% OF MORTGAGES IN US SINCE 1998 HAVE BEEN SUBPRIME.
THE WINDFALL IN THE SUBPRIME MARKET HAS AGAIN A LOT TO DO WITH THE PRIME MARKET AS WELL. THE AMERICAN WHO GETS THE LOAN FROM THE PRIME MARKET WILL AGAIN GIVE OUT LOANS TO LOT OF OTHER PEOPLE IN SMALL TRANCHES. THE RATE OF INTEREST WILL BE VERY HIGH COMPARED TO RATE HE
HAS BORROWED FROM THE BANK. ALSO HE GOES AHEAD AND SECURITIZES THESE LOANS. IT MEANS CONVERTING THE LOANS INTO FINANCIAL SECURITIZATION. THE BIG FINANCIAL INSTITUTIONS WILL BE PURCHASING THE SECURITIES. THE INVESTORS ARE IN TURN REPAID BY THE EMIS OF THE SUBPRIME
LOAN BORROWERS.
AS THE INTEREST RATES INCREASED AND SUBSEQUENTLY THE EMIS, IT BECAME INTRIGUING FOR THE SUBPRIME BORROWERS TO PAY THEIR INSTALLMENTS AND THEY DEFAULTED. THESE LED TO LARGE LOSSES IN THE SECURITIES INVOLVED AS WELL. THIS HAS LED THE BIG INSTITUTIONAL INVESTORS TO TAKE THEIR
MONEY OUT OF EMERGING MARKETS.
THE HUMAN FACE OF THE CURRENT FINANCIAL CRISIS IS LIKELY TO BE A LOW-EARNING AMERICAN, POSSIBLY SOMEONE WHO TOOK ON A MORTGAGE THEY COULD ILL-AFFORD AND WHOSE MORTGAGE
BROKER DID INADEQUATE CHECKS ON THEIR ABILITY TO REPAY. IT WAS ALSO AGGRAVATED BY RISING HOME LOAN RATES AND FALLING HOME PRICES.
THE INVESTORS ALSO WAR ON THIS BEING JUST AN EDGE OF THE STORM. THEY PREDICT MORE THAN $100 BILLION OF HOME LOANS LIKELY TO DEFAULT WHEN THE PROBLEMS WILL EVENTUALLY SPILL TO THE
PRIME MORTGAGE MARKETS. THE CREDIT RATING FIRMS STANDARD AND POORS AS WELL AS MOODY’S HAVE BEEN CRITICIZED WIDELY, AS THE SECURITIES WERE RATED AT THEIR BEHEST. BANKING GIANT
BNP PARIBAS WAS ALSO AFFECTED AS IT ANNOUNCED ITS THREE OF THE INVESTMENT FUNDS TO BE SUSPENDED DUE TO THEIR EXPOSURE TO THE SUBPRIME LOANS.
End of Emerging Markets Mania. Long Live Developed Markets
July 4 2013
Investors who wrongly called time on U.S. economic supremacy during the financial crisis are set to pay a hefty price for betting too much on the developing world, according to a top Goldman Sachs strategist.
The U.S. investment bank helped inspire a twenty-fold surge in financial investment in China, India, Russia and Brazil over the past decade, its chief economist popularizing the term BRICs in a 2001 research paper.
Sharmin Mossavar-Rahmani, in charge of shaping the portfolios of the bank's rich private clients, has been arguing against that trend for four years, however, trying to persuade investors and colleagues they were safer sticking with the developed world.
The past six months has substantially vindicated that view. China's boom is finally wobbling under the weight of economic imbalances including an undervalued currency, and emerging stock markets are down 13 percent compared to an 11 percent rise in the U.S. S&P 500. index over the same period.
"Many investors and market commentators have been too euphoric about China over the last decade and this euphoria is finally abating. Many just followed the herd into emerging markets and over-allocated to many of the key countries," she says.
"It is easier to be part of the herd even if one is wrong, than stay apart from the herd and be right in the long run."
The net gains for U.S. stock markets may just be a taste of the reassertion of western dominance that may emerge in the next few years, Mossavar-Rahmani argues.
Structural advantages like abundant mineral wealth, positive demographics and, most importantly, inclusive, well-run political and economic institutions make the United States the best bet going forward, she says.
"(Emerging market) investors are taking on so many risks compared with the U.S. where the risk is largely cyclical rather than structural," she says.
Many of the cyclical issues affecting the U.S. such as high levels of debt, are also on their way to being resolved.
"One thing that normally puts investors off from increasing their U.S. holdings is the long term debt profile, but we think the magnitude of the work done to address this has been underappreciated by investors," she says.
WEST IS BEST
The idea that authoritarian countries are less effective than open economies like the U.S. at incentivizing entrepreneurship and innovation is long accepted in academia.
Daron Acemoglu and James Robinson laid out the case for doubting the emerging power of Chinaand others in a book 'Why Nations Fail' last year, arguing poor institutions that entrench inequality will hamper a country's path to prosperity.
But this view was largely put aside by professional investors who allowed themselves to be swept up in a "mania" about the rewards up for grabs in emerging markets, especially China.
The widely held position, enhanced by the crisis of 2007-8, was that the developed world was entering a long decline and the best prospects for investors would be found in emerging markets, particularly in Asia.
That prompted a boom in emerging market themed equity funds, which in Europe multiplied from 13 in 2002 to 67 in 2012 according to Lipper, a Thomson Reuters company that tracks the funds industry.
Lipper data also shows the balance of money flowing into emerging market themed equity funds globally, including those focused on the BRICs, soared from 2.42 billion euros in 2008 to 51.23 billion euros in 2012.
In contrast, equity funds overall lost 21.5 billion euros in 2012.
UNREST
China's efforts to rebalance its economy from an export dependent to consumer-led model is likely to bring slower growth, more market volatility and greater potential for social unrest - a worrying trinity of red flags for foreign investors who have poured cash into China in recent years.
Meanwhile, mass protests are causing political crisis in Brazil and investors are fretting about ponderous, economically stifling bureaucracy in India. South Africa, sometimes called a fifth BRIC, is also struggling with a tide of labor unrest and infrastructure and social problems.
Data from fund tracker EPFR Global shows investors pulled out a record $10 billion from emerging markets debt and equity funds in the week to June 28.
Mossavar-Rahmani argues investors should not base decisions so heavily on which countries post the most impressive economic growth numbers, a temptation to which she says many succumbed when overallocating money to China.
Even when countries enjoy rapid economic growth, the increases in GDP do not equate to similar jumps in investment returns, she says, citing a study published in 2005 by the London Business School.
"If you rank the world's economies from fastest to slowest in terms of growth, the fastest-growing quintile actually generate the lowest investment return while the slowest third deliver the highest," she said.
Emerging market index - weightage of Indian companies
Emerging Economies : BRICS Debate(Brazil, Russia, India, China and South Africa). Brazil is going bust. Aug 28th 2015
Its currency is plummeting, unemployment is rising, its stock market is down 20% from a year ago and its president, Dilma Rousseff, has an 8% approval rating -- the lowest since 1992 when Brazil's president was impeached.
Once a major economic success story, Brazil sank into recession on Friday.
Its economy contracted 1.9% in the second quarter compared to the first. It was the second consecutive quarter of contraction.
"Pretty much everything is turning down," says Neil Shearing, chief emerging market economist at Capital Economics.
Compared with the same quarter last year, its economy shrank 2.6%, by far the worst performance in years, according to government statistics published Friday.
Here are the major reasons why Brazil, the second largest economy in the Western Hemisphere behind the U.S., is now in a recession:
1. Brazil's exports to China had exploded over the last decade. Now that China's economy is slowing, it needs fewer exports from Brazil.
2. Brazil's state-run oil company, Petrobras, is in a massive corruption scandal tied to many members in Rousseff's political party. The large money-laundering scandal spans across oil, business and political leaders in the country.
3. Prices for all of Brazil's key commodities -- oil, sugar, coffee, metals -- have tanked. Commodities are the engine behind Brazil's economy and they've lost value fast.
The recession comes as Brazilians are holding mass protests calling for Rousseff's impeachment. Although corruption isn't new in Brazil, the scale of the Petrobras corruption is large. Petrobras officials said earlier this year that the company lost $2 billion just in bribes.
In July, the scandal worsened: Brazilian police arrested executives at the country's electric utility, Electrobras, with charges related to money laundering at Petrobras. As investigators dig deeper, they're finding more and more officials at other agencies tied to the corruption case.
While it's just one corruption scandal, it's reach has eroded business confidence.
Investment fell nearly 12% in Brazil in the second quarter compared to a year ago, according to Capital Economics.
Its currency, the real, has lost 25% of its value against the dollar so far this year. Imports have fallen about 12% from a year ago.
For Brazilian companies that have borrowed in U.S. dollars, a plunging currency makes paying back the debt much more expensive.
Long term, a lower value currency could help, says Shearing, the economist. Countries across the globe -- in Asia and in Europe -- use currency devaluation to make the exports look more attractive to foreign buyers and entice locals to buy products made in the country. Brazil's exports did go up 7% compared to a year ago.
But it's too soon to get excited. Shearing warns the export figure nothing more than a "glimmer of hope," for Brazil's economic future.
For now, Brazil's economy appears to be in a recession that could last well into next year, most experts say.
Will India be replaced by Indonesia in BRICS
Both India and Indonesia are growing fast, but lately the smaller of the two as seen its economy expand the fastest
Entry into the Brics club is a seen as a sign of success - a statement that you have made it as an emerging economy.
When the phrase was first coined back in 2001 by Jim O'Neill from Goldman Sachs he intended it to encompass just four fast growing emerging-market countries - Brazil, Russia, India and China.
South Africa was added in 2011 - despite protestations from Mr O'Neill.
Being a part of Brics means you are instantly branded a sure bet - or at least that is the perception among investors.
Economists say the Brics make up approximately 20% of global gross domestic product (GDP), and by 2030 could possibly rival the combined economies of the G7 countries (the US, Canada, the UK, France, Germany, Italy and Japan).
But already there are concerns that the fast growing economies of the grouping are seeing some trouble ahead.
'Policy paralysis'
Take India, which once saw its economy growing at a rate of 9%, but is now suffering from "policy paralysis", caused by a combination of stalling economic reforms and political haggling, according to Ajit Ranade, chief economist with the Aditya Birla Group.
"But fundamentally, India's economy is still stable, its medium-term growth drivers are intact. Some policy momentum is visible these days.""The government has had a lot of political dramas, with corruption scandals unfolding over the last few years, and opposition parties stalling economic reform at every juncture," he says.
The Indian government says it expects the country to grow between 6.1% and 6.7% this year, faster than in 2012, when GDP grew by 5.3%.
Middle class
The slowdown in economic growth in India lies behind the suggestion that perhaps Indonesia should be the "I" in Brics instead.
On the face of it, India and Indonesia's economies have a lot in common - certainly more than just their first initials.
Both have large and young populations in fast growing economies driven mainly by domestic consumption.
There's a dynamism in the Indian economy - in manufacturing, agriculture, services - that just isn't there in Indonesia"
PK BasuMaybank
But India's economy is six or seven times the size of Indonesia's, and it has many more mouths to feed, with a population of more than 1.2 billion compared with Indonesia's 240 million.
While India has seen its economy stumble recently after many years of strong growth, Indonesia's strengths have made it the darling of international investors - although it too has also seen economic growth decline moderately.
The two nations also face many of the same problems, with their messy political systems, shoddy infrastructure in desperate need of upgrading, corruption and crippling poverty.
Open economy
One of the comments you always hear about Indonesia's potential is the rapid emergence of its affluent middle class, which is set to almost double by 2020 to 141 million people, the Boston Consulting Group forecasts, which means more than half the population would be classified as middle-income class or richer. Domestic consumption helps power the economy and attracts plenty of foreign companies into this relatively open economy.
India has a large domestic market too, but restrictions on foreign ownership make it difficult for foreign firms to get involved.
The company has also opened a research and development facility in India and now sees both markets as equally important, according to Vismay Sharma, L'Oreal's president in Indonesia, who has also worked in India.So last year, the global cosmetics giant L'Oreal chose Indonesia when it invested some $130m (£86m) in a state-of-the-art factory just outside Jakarta to produce 700,000 products per day, ranging from whitening creams to shampoos for both the domestic market as well as for exports to neighbouring countries.
Bricsi?
Indonesia's growing importance relative to India has done little to remove some of the real challenges for retailers and distributors doing business here, however, such as the fact that it is made up of islands.
The rate of growth means nothing without the quality of growth"
HS DillonSpecial advisor poverty alleviation, Indonesia
"You can't use road or rail everywhere, so you end up using ships," says Mr Sharma.
"You end up depending on ports, and that starts to put a lot of strain on the infrastructure."
Neither India nor Indonesia have good infrastructure, and both governments have pledged to spend billions of dollars to improve it.
But such lofty ambitions do not always deliver results. Last year, a much-lauded land acquisition bill was passed in Indonesia, but it has failed in its ambition to make it easier for the government to push ahead with infrastructure projects.
Obstacles such as these have resulted in analysts dismissing the idea that India should be replaced by Indonesia in the Brics grouping.
"You can add it as a sixth Brics, perhaps, making it Bricsi," says PK Basu, regional head of Maybank in Singapore.
"But replacing India doesn't make sense from any perspective. It's the first year in the last 15 years that Indonesia's real GDP grew faster than India. There's a dynamism in the Indian economy - in manufacturing, agriculture, services - that just isn't there in Indonesia."
HS Dillon, Indonesia's special adviser on poverty alleviation, agrees.
Each nation has moved into fast-growing economy status, each taking its own path to get there, but neither country has "made it", he says, insisting that "the rate of growth means nothing without the quality of growth".
Widespread poverty is there for all to see just a few kilometres outside of Jakarta's fancy financial district, where urban slums have cropped up in many parts of the city, as migrants from other parts of the archipelago have come here to find work. India's big cities too have seen mass migration into fast-growing cities that are becoming increasingly densely packed.
The poor in both countries are prone to avoidable diseases, resulting from poor sanitation, regular flooding and a lack of affordable healthcare.
"People say all the time we are one of the largest economies in the world, we are in the G20, we are this, we are that," says Mr Dillon.
"But what," he asks, "does that mean for the poor?"
By Karishma VaswaniBBC News, Jakarta 27 March 2013
Will Indonesia replace India in BRICS (Brazil, Russia, India, China and South Africa) — the league of powerful emerging nations — in the near future?
Although growth has slowed down in India, and Indonesia has emerged as the favourite for foreign investors, there's no chance of Indonesia replacing India, says Standard Chartered Bank managing director and senior economist Fauzi Ichsan.
"India will remain in BRICS. What can happen is that Indonesia may join BRICS by 2014 and the league may become BRIICS. India is a much bigger economy which is expected to do well in the coming years," Fauzi said.
"The growth rate of the Indian and Indonesian economies was 2nd and 3rd highest among the G-20 nations. Both economies have large domestic markets that helped shield them from global economic slowdown and global trade contracts. Indonesia also attracted global investors attention during this period when GDP growth has been over 6.5 per cent over the previous years," Fauzi told The Indian Express.
According to him, with Indonesia likely to join the BRICS club by 2014, India-Indonesia economic relations will strengthen further.
"Moreover, political-economic similarities between India and Indonesia would foster Indian FDI into Indonesia, as Indian investors are used to challenges in a young democracy," Fauzi said.
Despite global economic slowdown, trade between India and Indonesia has strengthened over the last decade.
"Indonesia which is a major coal producer in the world attracted several Indian corporates which are keen to invest in coal mines in the country. Nearly 70 per cent of India's coal requirements are imported from Indonesia," said Prakash Subramanian, MD and head, global markets, Stanchart, Indonesia.
Over the years, quite a few Indian corporate groups have set up operations in Indonesia. The Tata group, the Anil Ambani group, the Adani group and Essar have bought stakes in Indonesian mines.
India is Indonesia's fourth largest destination of non-oil and gas exports after China, Japan and the US. Exports to India rose 35 per cent to $13.3 billion in the year 2011. FDI from India rose 37 per cent to $ 4.3 billion mainly in manufacturing products like pharmacy, motor cycles and textiles. The bilateral trade is expected to rise to $ 25 billion by 2015, Jakarta-based Subramanian said.
Why India cannot be replaced with Indonesia in the BRIC?
In times of cynicism and over exuberance to report, all kind of theories abound, never mind if some of them could have serious judgmental errors.
The economic bedlam of the last few days and the fall in the Indian rupee has given rise to a new theory that is floating around, “Will Indonesia replace India in the BRIC?”
Now BRIC is not a formal bloc, but just a term coined for Brazil, Russia, India and China. What in effect the articles go on to mean is that would India be ignored for Indonesia by investors, particularly foreign investors.
Now, the Indian economy is suffering from inertia alright, but, the elephant can dance. It has in the past and it will in the future. Now, for the naysayers and doubters.
Just a few days back, there were reports that India would emerge as Facebook's largest market, overtaking US as early as 2015. Now, what would happen if Facebook decided to ignore India today for Indonesia. It would lose its largest market in three years from now – a colossal loss indeed.
Earlier this month officials of Reckitt Benckiser (world's largest producer of household cleaning products) with brands like Dettol and Strepsils said it expects the Indian operations to become its biggest market globally in terms of revenue in the next 3-5 years. If India can contribute the largest revenue to a MNC behemoth like Reckitt, which has operations in 200 countries, that is fantastic indeed.
Last month LinkedIn said India had become its second largest market ahead of China. Similar comments have been echoed by Starwood and the US Exim Bank, which claim that India would be their largest markets in the next few years.
Indian stock commands a price to earnings multiple that is the highest amongst emerging and developed economies. The Sensex companies P/E mutiples, trade at a premium to developed economies. Why do investors pay a premium to own Indian stocks? It's simply because they bet on growth and are willing to pay a premium for the growth.
Foreign Direct Investment in Indonesia totalled, $19.3 billion in 2011. In FY 2011-12, FDI in India increased by 46.4 percent to $ 28.4 billion. One report says that India and China together attract 63% of the emerging market private equity.
Now, there are a series of comparisons that make India a better bet for foreigners, but let's take one last and the most important one – India's young population.
Sam Pitroda was recently quoted by IANS saying,"India's 238 million 15 to 24 year-olds equals the total population of the world's fourth most populous country, Indonesia." India's young population will increase by 136 million by 2020, as against 23 million anticipated for China.
That's going to be a huge working population in the next 10 years, with a market size that is gargantuan.
Foreigners can decide to ignore India due to short term concerns, but, may well lament their folly for not taking a longer term view. As for the reports on Indonesia replacing India in the BRIC, it may just be a case of "putting not a foot, but feet in the mouth".
Emerging Markets Outlook for 2016
9/12/15
A recent Bank of America Merrill Lynch survey confirmed the sentiment extreme here, finding that fund managers haven’t been this pessimistic about emerging markets equities since 2001.
Here’s another confirmation: The MSCI Emerging Markets Index trades at a price-to-book ratio of around 1.3 vs a 10-year average of 1.8, says Pablo Echavarria, associate portfolio manager at the Thornburg Developing World FundTHDIX, -1.27% “The asset class bottomed at one times book during the financial crisis. We are not quite there, but we are close,” he says.
What’s the best way to navigate emerging markets investing? Very carefully, according to four EM fund managers I recently checked in with. “For the average investor, it is really time to be selective,” says Xian Liang, co-portfolio manager to the U.S. Global Investors China Region Fund USCOX, -1.18% “Pick your spots.”
Read on to see what four EM managers say this means.
Invest in the right regions
EM bears cite three main problems: the China slowdown, excessive debt and weak commodity prices (which we’ll discuss, below). But for Gary Greenberg, portfolio manager at the Calvert Emerging Markets Equity Fund CVMAX, -1.30% another challenge is also at work. Greenberg is worth listening to because his fund has beaten its benchmark by around 5 percentage points a year, annualized, over the past three to five years, according to Morningstar. That’s a great record.
Greenberg says a bigger issue is that the old emerging markets game plan of growing rapidly by exporting cheap goods produced by low-cost labor — and never mind the pollution — no longer works as well. Instead, EM countries have to upgrade their economies by encouraging production of more sophisticated goods and services and stronger domestic consumer spending.
Countries that get this, or are on their way to making the transition, are the best places to be. Greenberg says Chile, Taiwan, Poland, the Czech Republic and Korea have already made the transition. Countries on their way include India, Indonesia, China and Mexico.
“Both represent good environments for companies to operate in,” says Greenberg, and he favors the latter group.
Countries behind in this transition, either because their economies are commodity-focused or because they are distracted by geopolitical tensions or domestic political issues, include Venezuela, Argentina, Brazil, Turkey, Russia and South Africa.
Go with the Chinese consumer
EM bears like to harp on the industrial-sector slowdown in China. But as I recently wrote, there are plenty of signals from U.S. companies in China that the Chinese consumer is doing OK.
EM portfolio managers also see signs of consumer strength inside China. Calvert’s Greenberg cites continued wage growth, and robust spending trends at restaurants and big online retailers like Alibaba Group Holding Ltd. “The consumer in China is doing OK,” says Greenberg.
Go with India’s infrastructure build-out
In some ways, India is like China was 20 years ago. It has a lot of young people entering the workforce, and it’s in the midst of an investment boom to build out its infrastructure and manufacturing base. To do all of this, it has to upgrade everything from its ports and transportation system, to its electricity supply and payments system.
Most of the companies that will benefit directly are listed only locally. But two Indian banks listed on U.S. exchanges offer a way to get exposure.
One is HDFC Bank Ltd. This bank is growing its loan book rapidly while keeping a lid on dud loans. It’s also a play on the megatrend of offering more banking services to India’s vast rural population. Its chief competitors are less-efficient government banks, so it has room to take market share. “This bank is not cheap, but it is a good growth story,” says Greenberg. This is a top-five holding in the Calvert Emerging Markets Equity Fund, which Greenberg manages.
The other is ICICI a commercial lender that should benefit from the build-out of the infrastructure and industrial base.
What to avoid
Greenberg is cautious on Chinese banks because they aren’t transparent about underperforming loans. He suspects many of these banks will have to raise capital over the next five years. Greenberg is also cautious on commodity-related stocks because of what he foresees as ongoing sluggishness in the Chinese economy over the next several years. A recent report by Barclays predicted that demand for copper and gold would suffer the most, among metals, from China sluggishness.
But what about the bear case?
And what about the bear case behind our Economist magazine-cover indicator? The story cites high emerging markets debt loads, weak commodity prices and a China slowdown as three of the main reasons to worry. But these may not be such big negatives, maintains Eric Moffett, portfolio manager of the T. Rowe Price Asia Opportunities Fund TRAOX, -0.98%
While it’s true that there’s been a big increase in debt levels in China, it’s important to keep in mind that consumer debt, which can wreak the most havoc on economies when it gets out of hand, is extremely low. “Here in Asia, particularly in China, there is very little consumer leverage,” Moffett said in a recent interview from Hong Kong. He notes that a quarter of all residential real estate is purchased with cash, and those who use mortgages have to put down 50%. “The consumer balance sheet is fine,” he says.
Meanwhile, state-run companies in China have a lot of debt, but they have borrowed from state-owned banks. These banks, and the politicians behind them, don’t have an interest in playing hardball over loans. “That reduces the [probability of a] day of reckoning,” says Moffett.
As for weak commodity prices, Moffett notes that most of Asia, which accounts for about 70% of emerging markets GDP, actually benefits from lower commodity prices. They are more buyers than sellers of commodities, except for Malaysia. Obviously, though, Russia and Brazil are being hurt by weak commodity prices.
Finally, while it’s true China’s economy will most likely continue to slow, the risk of the dreaded hard landing is probably low. China has lots of dollar reserves it can use to shore up the banking system. And unlike the Fed, China’s central bank still has room to cut interest rates to help the economy. It also has room to lower reserve requirements at banks, which can encourage lending.
“The Chinese government has a number of things it can do to control the speed of a slowdown,” says Moffett. “And some big, uncontrolled collapse is not in the interest of the government.”
India, China will drive emerging market outperformance in 2015: Shankar Sharma (in 2014)
Q&A with vice-chairman and joint managing director, First Global by Business Standard
Despite growth concerns emanating from major global economies amid falling crude oil prices, Indian markets have hit record highs in 2015. Shankar Sharma, vice-chairman and joint managing director, First Global (Twitter:@1shankarsharma) tells Puneet Wadhwa that he expects central banks across the globe to maintain an accommodative monetary policy. The world, led by Jim Rogers and Goldman Sachs, over-intellectualised thecommodity boom that started in 2002-03, he believes. In the Indian context, he prefers avoiding Oil and Gas, Metals, Infra, Power and Telecom sectors. Edited excerpts:
How do you see the global markets playing out in 2015? How long, in your opinion, will the central banks be willing to inject liquidity to support/revive growth?
Every year since 2009 has been very tricky and almost always full of surprises that defy consensus. How we pine for the beautifully predictable 2004-07 era! The US is almost certain to raise rates, India looks certain to cut rates by a bit more, Eurozone has really no options left except a huge QE(quantitative easing), Japan is failing to revive despite the yen being at 115-120 and massive QE.
In my view, by and large, central bankers across the world have simply no option but to be accommodative. The world is struggling and my view since 2009 has been that the world will continue to struggle for a while to come till the excesses of debt have been purged. Given this struggle, given the threat of deflation, money will have to continue being easy in most part.
Don't you think equities, as a result of liquidity injection, have been artificially inflated to worrisome levels?
Equities have been inflated across the world; multi-year highs for many markets have come despite economic growth being tepid. Even the US 5% GDP growth is a bit sleight of numbers. A large part of it has come from the increase in net exports, not because exports increased, but because imports fell. The effect that $40 oil will have on the US is by no means a clear positive.
Fact is, nobody living has seen a liquidity rush like what we have seen since 2009. Hence, all our theories of what is "fair value" have been tossed out of the window. What is real value, and how much is the froth - well, there are no deterministic answers.
The world is facing a major deflationary threat. Bond yields across the world are plummeting. Now, equities are supposed to be the best hedge against inflation, gold aside. So what good are equities supposed to be in deflation? I haven't figured this one out yet!
What are the key triggers and risks for the global equity markets as we head deeper into 2015? Which regions / markets could possibly weather the storm better?
Emerging Markets (EMs) have been trashed since 2011/12, well against consensus. The world is underweight EMs and over-weight the US, which was the exact opposite of what it was in 2011. This could set us up for a surprise reversal trade, when EMs actually do better than the US this year, at least for a while, largely because of China and India.
We have been bullish on China since late July 2014, when it became clear to us that the Dollar Index was going into a long term break-out (it was 80 then, 92 now). Given this, our view on commodities became very, very negative, and we alerted clients about Oil going to $65-70 though never thought we would see the $40s so soon. EM currencies are falling, and China is doing very well, because that is the only EM with a dollar neutral market (except the UAE).
The Great EM Unwind: Unwinding US QE, China’s Leverage and EM Domestic Credit - triple unwind-How Will EMs Play Out from Here How Will EM Play Out from Here? Morgan Stanley August 7, 2013
We believe that one or more, but not necessarily all three, headwinds will play a dominant role at any one point in time over the next 12-18 months. Over that period, we expect EM economies to be split into two ‘blocs’, good and bad, with a third one where uncertainty hovers like the proverbial sword of
Damocles.
Under pressure: Economies where the structural model of growth is severely challenged (China, Brazil and South Africa – with Russia included but playing out better than the others) are likely to remain under pressure. While China and (to a lesser extent) Russia will likely remain under pressure
because of their idiosyncratic, structural challenges, Brazil and South Africa are suffering from both idiosyncratic, structural issues as well as global headwinds that have tightened financial conditions (see our ‘four corners’ approach in The Global Macro Analyst: Why Have Markets Forced EM ‘Tightening’ This Time?).
Relative winners: On the other hand, economies where domestic fundamentals are not in question are more likely to benefit. This includes not just Mexico the reformer but also structurally clean economies like Poland and the Philippines.
The inbetweeners: Tighter financial conditions have been forced upon some EM economies, particularly Indonesia, India and Turkey. However, they all have something going for them. Indonesia and Turkey do have better domestic fundamentals than many give them credit for, while India’s structural reforms since September 2012 are the reason why we have remained constructive on the medium-term growth story there. Should these three economies play to their respective strengths and avoid policy mistakes, the risk of significant negative spillovers can be abated. India, for example, could step up structural reforms rather than fiscal spending. Indonesia could slow the economy down to an acceptable level which lowers its current account deficit and undertake structural reforms to strengthen its fundamental growth drivers. Finally, Turkey could use its flexible
monetary policy mechanism while indicating better control over credit growth, which would lower its current account deficit as well.
EM economies are going through a very tricky phase thanks to the great unwind. While many are talking about structural reforms, the ability or willingness to deliver on such structural reforms is in shorter supply. The rigidities and unsustainable models of growth that are constraining emerging markets are the very source of their promise. Should these rigidities and unsustainable models be discarded, emerging markets can again convincingly outperform in terms of growth.
Unfortunately, a return to the glory days seems some distance away at the moment.
Oil (petrol) price breakup and why they are increasing and expected to increase further
Exploration costs (about 5%) - finding the oil and confirming it's viable. Simply setting up a deep water exploration well can cost $100-200m, and only one in four is successful [3].
Capital costs (about 20%) - leasing land, building rigs etc.
Operating costs (about 10%) - paying your crews, transport, maintaining heavy machinery, managing reserves, re-drilling blocked wells etc.
Tax (about 40%) - which varies hugely between counties and states - for the UK about 62%, Norway is over 80% [1] and 35% in the US [5].
Cash margin (about 25%) - which includes profit and money set aside for future investment and rainy days.
The oil price isn't the cost of petrol in your car. To get to your pump, you also have to factor in:·Distribution and Marketing (8%)
·Refining (14%)
All of this is just global averages though, and reality is more complex.
There's truly no standard cost of oil. It costs about $2-$3 to extract a standard barrel from the ground in Saudi Arabia, whereas a barrel taken from tar sands in Alberta can cost more than $60 [1]. Some oil costs much more to refine. And so on.
The cost on the open market is volatile and decided by a mix of supply, demand and anticipation. When oil production is disrupted (as happened recently in Libya) this can fuel speculation which itself drives prices higher.
One thing is clear: all these costs are increasing. Exploration is becoming more expensive; more obscure oil is harder to extract and costlier to refine. Demand is rising much faster than supply. And increasingly governments are raising taxes on oil to reinvest into alternative energy.
Remember back in 2000, when prices had "soared" to $30 a barrel? President Clinton even "refused to rule out any US action" [5]:
$30 seems pretty funny now, right? Just imagine 10 years hence.
Black Monday anniversary: How the 2017 stock market compares with 1987
Is the stock market’s seemingly relentless 2017 rally anything like the 1987 run-up that ended 30 years ago Thursday with the most devastating one-day plunge in Wall Street history?
At first glance, investors might think so. And charts arguing the case have made the rounds from time to time. But on closer examination, many of those comparisons don’t hold water.
Here’s a look at a pair of charts from LPL Financial that illustrate the point.
The S&P 500 SPX,+0.51% chart above, which resembles overlays that have circulated on social media, looks a bit ominous. But as strategists John Lynch and Jeffrey Buchbinder point out in a note, the comparisons are misleading. The 100-point increase in the 1980s on the right scale is a much bigger percentage rise than the roughly 450-point rise on the left.
When 1987 is compared with 2017 using percentage gains, the current rally pales in intensity, they note, while also using a three-year window to strengthen the point:
“From the start of 1985 through the 1987 peak, the S&P 500 more than doubled in price (a greater than 100% gain). Over an equivalent time period today (the start of 2015 through the 2017 peak), the S&P 500 is up 24%,” Lynch and Buchbinder wrote. “Stocks were a lot more stretched back then, making a sharp move lower more likely.”
The S&P 500 ended Black Monday with a decline of more than 20%—a similar move would knock more than 500 points off the index at current levels. The Dow Jones Industrial Average DJIA,+0.71% plunged 508 points, or nearly 23%. In current terms, a fall of the same magnitude would knock the Dow down by more than 5,000 points.
Few similarities
While stocks don’t appear to be as stretched as they were in 1987, analysts do argue a pullback may be overdue. The S&P 500 has gone 240 trading days without a one-day drawdown of 3% or more—just a day shy of the record of 241 days in 1995-96.
Sam Stovall, chief investment strategist at CFRA, noted that today’s bull market—the second longest on record—is 103 months old versus the 60-month duration of the 1982-87 bull that ended on Black Monday. More important, while 12-month earnings growth through the second quarter of 2017 was 121% versus 17% in 1987, the trailing 12-month price-to-earnings ratio for the S&P 500 is 23.5, versus 20.3 in 1987. Also, he noted, the dividend yield was more attractive in 1987 at 2.7% versus 2% now (see table below).
CFRA
But all in all, history indicates a comparison with 1987 isn’t warranted, he agreed.
While the stock market this year has enjoyed a slow, steady, low-volatility advance and continues to notch record after record. In 1987, the S&P 500 peaked around two months ahead of the Oct. 19 crash, Stovall said, noting the S&P 500 had also declined by more than 16% through Friday, Oct. 16, from its Aug. 25, 1987 high, which should have rang some alarm bells.
“Ultimately, when comparing today’s fundamental foundations with those from 1987, one will quickly conclude that there are very few similarities between then and now,” Stovall said.
Market structure concerns
So nothing to worry about, right?
Not necessarily. The 1987 crash, while preceded by a frothy performance, is seen in large part as a failure of market structure. The interplay between the rise of computer-driven trading and the use of portfolio insurance, a strategy that prompted the increased selling of stocks and stock-index futures as declines mounted; arbitrage between stock-index futures and stocks; and the inability of some specialists to fulfill their duty to provide liquidity, share the blame in many accounts of Black Monday.
“While portfolio insurance doesn’t carry the same clout today as it did in 1987, short volatility strategies are equally pro-cyclical in nature with unlimited exposure, ETF volumes dwarf single stock volumes creating distortions in fast markets, while [high-frequency] trading has already shown its preference for finding foxholes versus fighting when markets trade outside their log-normal models,” wrote Jeffrey deGraaf, chairman of Renaissance Macro Research, in a Wednesday note.
DeGraaf isn’t calling for a crash soon. He’s argued that stocks could be setting the stage for a “melt-up,” in which investors fearful of missing out on a rally stampede into the market and drive a surge. But he and other market veterans have expressed concerns about a more complex and untested market structure.
“These are different flavors, but similar in their spirit to the problems that plagued markets 30 years ago,” he said. “Our money is on the next crisis looking more like 1987 than 2008.”
The 1987 bounceback
Meanwhile, Stovall makes the case that even in the event of a similar plunge, there would be comfort to be taken by looking back at the 1987 drop.
While the S&P 500 dropped more than 20% on Black Monday—a plunge that would take more than 500 points off the index at current levels—on its way to a peak-to-trough decline of 33.5%, the move took only 101 calendar days, versus the average 419 it took to complete the 12 bear markets seen since 1946, he said. And while the 1987 total decline was pretty much equal to the average drop for all bear markets, it took 154 fewer days to get back to break-even than the average.
“Like ripping off a Band-Aid, the experience offered by this unpleasant market shock indicates that a future market crash may also conclude and recover much more quickly than a slower, more deliberate, bear market,” he said.
Sparrow vs pigeon
Taking over 100 trades a day, this IT engineer has earned his financial freedom
Taking over 100 trades a day, this IT engineer has earned his financial freedom
His humble background shows up on his trading style where he goes after a trade even if there is a very small profit potential
Trader Mark Weinstein during his interview with Jack Schwager for the book Market Wizards made an interesting observation. When I trade at home, he says, I often watch the sparrows in my garden. When I feed them bread, they take just a little piece at a time and fly away. They keep on flying back and forth, taking small bits of bread. They may have to make a hundred stabs at a piece of bread to get what a pigeon gets at one time, but that is why a pigeon is a pigeon. You will never be able to shoot a sparrow, it is just too fast.
That is how Weinstein trades and so do a number of scalpers who are not only risk-averse but are happy by taking a number of small profits and concede only a small part of their capital if they are wrong.
Yet there is a method to the madness that the scalpers do. They, like Weinstein's sparrow, make a healthy living by trading small but trading often.
Jegathesan Durairaj (known as Jegan on social media) is one such scalper, who punches over 100 trades a day, especially on derivative settlement day.
Successful traders trade their personality, so does Jegan who says he is a hyperactive person. Also his humble background (his parents were masons in a village close to Madurai) shows up on his trading style where he goes after a trade even if there is a very small profit potential, not leaving any money on the table.
Jegan studied his way out of poverty by getting a (Masters of Computer Applications (MCA) and worked as a senior technical lead in one of the top IT company. He has recently resigned from his job and will be a fulltime trader. Jegan's confidence comes from the fact that he has won a popular trading competition for 10 consecutive times and amassed enough capital and experience to venture on his own.
In an interview with Moneycontrol's Shishir Asthana, Jegan speaks about his prolific trading style and explains how he trades.
Q: Can you give us a little background about yourself?
A: I was inspired by the book Rich Dad Poor Dad by Robert Kiyosaki. I looked for various business avenues to accumulate wealth with small capital. One such avenue was trading in equity markets which requires small capital to start with.
One thing that struck me from the book was to imitate what the rich men do. In my reading on the markets, I found out that the big institutions and rich investors traded in options, that too in selling options or writing options.
So I went through many workshops, read books and articles to learn about option selling and ever since I have been an option writer.
I have been writing a blog on my analysis of the market and from it I used to arrive at the strategy I have to adapt to trade next day.
As for my background, I have been in the software field for the last 15 years after completing my MCA. Till four years back I was not even aware of what a demat account is. Only recently my parents have opened a bank account. So for me exposure of financial markets is new.
Q: You mentioned institutions do a lot of option writing but they also invest in equity, why did you not follow that route.
A; I do respect investing, but by nature, I am not an investor. I am a very hyperactive person so I do not have the patience to be an investor, short-term trading suits me better. But what I have done is I invest through the mutual fund. Nearly 90 percent of the money I have is in the balanced fund. I use this investment as a margin with the broker to do my option writing.
Q: In options selling do you only do intraday.
A: No I do both position and intraday, but nearly 50 percent of my profits come through intraday, that too by trading on the expiry day only.
Most of my trading is in index-related options. Within indices, I prefer to trade in Bank Nifty because it offers a weekly expiry. In weekly options, the time decay is very fast, so if you sell options and get the direction right the returns are faster. In case of Nifty, I hold it for a longer period of 10-12 days provided the view remains the same.
Q: In positional option writing what kind of strategies you follow. Are you taking naked short positions (without any hedge or having the underlying investments)
A: I no longer trade a naked position, I always a protected position. My main strategies are calendar, butterfly, iron condor and expiry related trading. I do short straddles for positional trades and short strangles for intraday trades.
In some of these strategies, like the iron condor, the returns are less at around 18 percent per annum. But for me, the 18 percent is over and above the return I get from the investment in the balanced fund which I am using as a leverage.
Q: Let's assume that your view of the market is that it is going to be flattish or bullish, what strategies will you use?
A: If the view is flat I will use a double butterfly using both the call and the put options. If the view is of a bullish market I will use a put calendar. I will hold on to the position till expiry if my view of the market does not changes. In case it changes or if there is a shortfall of margin only then I will square off my position.
Q: How do you form a view of the market, is it technical analysis or are there other data points you look out for.
A: I primarily look at futures and options data to arrive at a view. Open interest analysis, put-call ratio (PCR) analysis, delivery volume and Max Pain point. I do look at technical charts but I am more comfortable and have trust in the data points.
Q: Expiry day trading accounts for half of your profit and is a day when you take more than 100 trades, can you walk us through how you trade on the expiry day.
A: First of all I never plan to take 100 trades or whatever the number of trades comes during the day. The number of trades is decided by the market condition.
What I do is I split my day's trading or exposure limit that the broker gives me into 20 units of 5 percent each. Which means I am taking a position of only 5 percent of my day's limit in every trade I take. Now as the market moves I form a view and take a position. I trade looking at various time frames. So if the market is falling I will keep on selling call options looking at different time frame charts. And if it is moving higher I will sell put options.
Now on expiry day, the market is very volatile and the premium of the options fluctuates from say, Rs 1 to Rs 12 in a matter of minutes. In order to save my position, I hedge by buying a lower strike price option, but only a small part of my exposure.
As the market moves option price changes, I start booking profit on options where it has overshot the theoretical price but it is in my favour. I keep on doing this adjustment and all the time chipping away profit from the market. The more volatile the market the more trades I take. The higher number of trade is to defend my position.
I only trade out-of-the-money options and in those strike prices which are least sensitive to market movement. I have a mental map of what premium I am looking for, which has been created by experience. I know the premium I am looking for at each time.
So at 10 a.m. I will be looking to sell an option with a price of Rs 5, at 12 p.m. I am searching for options at Rs 3, by 3 p.m. I am selling options that are trading at Rs 1. On expiry day these prices might be available on strike prices that are 700 points away from where the market is trading. On a normal day, these prices may be 300 points away, but high volatility results in a higher premium.
Q: How do you manage to trade with your job?
A: I have an arrangement with my office where I get a day off on every Thursday (the expiry day for Bank Nifty). But now I have already put down my papers and will be trading fulltime. I wanted to turn in to a full-time trader by 2020 but the markets have been rewarding so I decided to prepone it.
Q: You also train traders, what type of students do you take.
A: I only take traders who are already trading in options and know the basics. I do not have to teach them what is call and put option. The second criteria are that they should have at least Rs 10 lakh as trading capital. Since my trading style requires one to take multiple positions there has to be enough capital to take the positions.
I have trained around 90 people till date, some continue to trade while others find it difficult to take 100 trades in a day.
"MORE MONEY WILL BE CREATED IN THE NEXT 7-8 YEARS THAN INDIANS CREATED IN LAST 70 YEARS"
Super excellent article on Indian Economy with solid statistics in public domain* ...
Nilesh shah- MD - Kotak AMC on the Indian economy: 2018
I will take liberty to point out certain factors.
a) *The movie Sanju had a bigger opening collection than Bahubali 2 which was a far grander movie. It shows that urban consumption is growing at a reasonable pace.*
* Sonalika tractor sold 100,000 tractors last year. Mahindra & Mahindra, Escorts are also showing all-time high levels of tractor sales*.
*Clearly, that shows that rural economy is doing well.*
*Maruti Baleno has a four months' waiting period. If consumers do not have money, then how come they are waiting for four months to get the car?*
*Tata Motors' commercial vehicle production is at an all-time high record level. Generally commercial vehicles are pulse of the market, pulse of the economy*.
*If commercial vehicle sales are happening, certainly economy is rebounding.*
*Cement volume are showing double digit growth*. The cement numbers for this quarter has come ahead of expectation. If we see a variety of other FMCG companies like Dabur, Lever and ITC, their commentary is also positive in terms of rural FMCG growth.
*Put all these numbers together and you realise that the economy seems to have now rebounded, the momentum is picking up, it is reflected in last four months of IIP numbers which was above 7%.*
*It is reflected in GST collections which have crossed Rs 1 lakh crore for the first time*.
*It has taken 70 years for India to Reach 2.5 Trillion Dollar Economy*, though India will take only 7-8 more years to reach 5 Trillion i.e. the *Total amount of Money that was made in Last 70 years would be made again in the next 7-8 Years.* The Question is how much will you make? I have absolutely no doubt that the ones who can catch a few right trends in next 7-8 years are going to be very very rich.
*China took 5 years to double, US took 10 years to double from 2.4 to 5 trillion$, it is estimated that India will take 7 years* to get there.
The Idea is simple, there will be 100's of entrepreneurs out there who will increase their profit 10-15x from current levels, they will grow at 30-40% and we need to back them. The Biggest Trend is India.
Within India there will be Sector Trends that will change every 3-4 years like.
Automobiles – *India Sold a whooping 2 Crore Two Wheelers India V/S 1.7 Crore Two Wheelers sold by China.* Interestingly India Sold 33 Lakh Passenger Cars in FY2018 V/S 2.4 Crore in China . Slowly but Surely in the next 10 years we are confident that India will sell 1 Crore+ Cars and the average ticket size of a car would also Increase rapidly. Out of these 33 Lakh Cars, more than 50% i.e. 18 Lakh Cars were sold by Maruti alone. *Maruti has a Market cap of 2.6 Lakh Crores and did Profit of about 8000 Crores in FY2018.*
*Financials – This is one space where the Opportunity is Largest into all Three Spaces i.e. Lending, Protection and Wealth Management.*
Lending – *The Top 45 Business houses in India are 50% of Nation's banking debt even after nationalization of banks.*
The Top 20% of India is well banked and Opportunities are now on the lower ticket size retail lending (80% of Population).
*With Upsurge of MFI, SME Lending, consumer finance, affordable home loans, Retail Credit is a big trend which are typically small ticket size loans with higher NIM spreads. India's Credit needs will grow at 15-16%, whereas Smart private Bankers/NBFC can grow faster at 20-30% easy for next 7-8 years.* Their is an Opportunity to grow look book by 3-5x easily.
Protection – This Again is a multiyear theme, from Life to Auto insurance to Health to crop to even your cellphone. Here not only there will be Growth of 15-17% in the general Market but there will be large Market share shift from PSU Insurers to Private companies, we believe Private Insurers can grow 20%+ for a long long time.
*Wealth Management & Investment- We Strongly believe that Markets aSanjay Dudhoria Cfo Rubamin:
re underestimating the financialization of savings as a theme, the total Profit pool of top 5 Asset management companies (57% Market Share) in India is just 1800 Crores in FY2017. The Profit Pool is so small that one midsized popular hedge fund Pershing Square made more Profit than the Entire Indian Asset Management Industry, We at Stallion Asset have absolutely no doubt that the Profit Pool will grow multi fold in next 5-10 years and there will be massive wealth Created in this space.*
Air Conditioners – I hope the Indian summer is not killing you because you are in A/C room right now reading this blog but *you will be suprised to know that only 4% of Indian Households own a Air Conditioner, (10% Indian own Air-Cooler) whereas 85% of Indian Household have fans.*
In China the *Penetration of Air conditioners grew from 8% in 1995 to 70% in 2004. Voltas is the Market Leader with 24% Market share in A/C in India and Sold 10 Lakh Air conditioners this year and will do a Profit of 650 Crores in FY2018 and has a 20,000 Crores Market Cap*. 10 years from today, I dont know what profits Voltas will make but I am confident that India's Penetration of Air Conditioners will go up from 4% to at-least 15%.
Large Format Retail Stores- There are 3700 Tesco Stores in UK, 4100 Walmart Stores in USA where in India, D-Mart has 155 Stores and Big Bazaar 260. Remember The population of UK is 6 Crores, the Population of USA is 32 Crores and Population of India is 125 Crores.
*Conclusion* – I repeat "MORE MONEY WILL BE CREATED IN THE NEXT 7-8 YEARS THAN INDIANS CREATED IN LAST 70 YEARS" There are opportunities to make it large. There will be cyclical ups and downs.
*Don't Miss this BIGGEST TREND EVER*
JOKES
RIDE THE TIDE
India Fund Flow vs Other EMs
Chairman/CEO's annual shareholder letter as a secret door of stock picking
(Marketwatch 2020)
Individual investors ask what resources to consult when hunting for great companies. My advice: read the shareholder letter the company sends out every year. Next to the financial figures, it is perhaps the most important and accessible source of valuable information.
These communications reveal a lot about a company and its CEO. Some obfuscate, others patronize, and many appear to be ghostwritten, but the best ones share business insights that help readers understand a company. Use these clues as filters just as you would the company's financial statements. Many companies post such letters on their websites and they are usually part of the annual report.
The gold standard of the genre is Warren Buffett, whose pithy statement from his 1997 letter to shareholders of Berkshire Hathaway sums it up:
"When you receive a communication from us, it will come from the fellow you are paying to run the business. Your Chairman has a firm belief that owners are entitled to hear directly from the CEO as to what is going on and how [he/she] evaluates the business, currently and prospectively. You would demand that in a private company; you should expect no less in a public company."
Buffett designed his letter as one of many tools used to attract what he calls high-quality shareholders to Berkshire. Quality shareholders (QSs for short) maintain the longest average holding periods and most concentrated positions — Buffett once boasted "that over 95% of our shares are held by investors for whom the holding is at least double the size of their next largest." High densities of QSs in a company are associated with superior corporate performance.
In his 1983 shareholder letter, Buffett explained: "To obtain only high quality shareholders is no cinch. . . . In large part, however, we feel that high quality ownership can be attracted and maintained if we consistently communicate our business and ownership philosophy—along with no other conflicting messages . . . Through our policies and communications — our "advertisements" — we try to attract investors who will understand our operations, attitudes and expectations. (And, fully as important, we try to dissuade those who won't.) We want those who think of themselves as business owners and invest in companies with the intention of staying a long time. . . . "
Buffett has attracted almost exclusively QSs at Berkshire. Dozens of CEOs emulate his shareholder letter "advertisements" to attract QSs as well. Numerous surveys of shareholder letters rank them according to various indicators of quality, some statistical and some judgmental. Despite such variety, the same names appear often in both published lists and private polls — invariably starting with Buffett — and they tend to attract a high level of QSs.
Consider together the annual rankings of the best shareholder letters published by Linda Rittenhouse, a leading expert on the genre. and the Quality Shareholders Initiative at George Washington University at George Washington University (QSI), which ranks more than 2,000 large public companies by QS density. Among the Rittenhouse top 25, 80% rank in the top half for QS density. Here are 10 at the top of both rankings:
Get the tools you need to succeed in the market, with real-time market data, news, and analysis from MarketWatch — one of the most reputable brands for personal finance, business, and market news.
The QSI research, in turn, led to curating the best of the best into a short book, Dear Shareholder, published in 2020. Selections from the letters of leaders of 17 companies are featured, chosen based on the quality of both the letters and the shareholder base. Ten of these include:
• Weston Hicks, Alleghany Corp. US:Y
• Jeff Bezos, Amazon.com US:AMZN
• Warren Buffett, Berkshire Hathaway US:BRK
• Robert Keane, Cimpress US:CMPR
• Mark Leonard, Constellation Software US:CNSWF
• Brett Roberts, Credit Acceptance US:CACC
• Prem Watsa, Fairfax Financial Holdings US:FRFHF
• Ian Cumming and Joe Steinberg, Leucadia National (Now Jeffries Financial Group) US:JEF
• Tom Gayner, Markel Corporation
• Joe Mansueto, Morningstar US:MORN
As with Buffett's "advertisements," these letters have in common an emphasis on long-term thinking and illumination of principles that QSs focus on, including strategic competitive advantages ("moats"), capital allocation, and corporate mission.
In utilizing shareholder letters as an investment screen, please note that single letters taken alone are less meaningful than an arc over many years. Quite a few CEOs have written one great letter, but the best keep it up year after year. Studying the letters of a large number of companies over a long period of time yields valuable guidance for shareholders and managers alike.
Growing into the role
Shareholder letters provide insights into a company's values, culture, and outlook. It is the forum of greatest freedom for CEO expression, as the letter is both optional and unregulated. As such, intelligent investors can improve not only their understanding of particular businesses, but also their returns on investment.
A common theme to watch for: growing into the letters. The best letters are those of the experienced leader — outstanding executives tend to develop in the job and get better with engagement.
Another feature of outstanding letters is originality, reflecting the personality of the writer and culture of the company. The best letters — as with any kind of writing — are those written with sincerity and passion.
Above all, the golden rule of shareholder letters: Buffett says he writes to provide shareholders information he would want to have if their "positions were reversed."
A degree of repetition is valuable — especially on enduring core values and practices. One endearing feature of many letters for QSs is core principles that do not change.
Finally, the best shareholder letters tend to focus on challenges, not triumphs. Phil Carret, a legendary investor, though more inclined to diversify than most QSs, observed: "I'm always turned off by an overly optimistic letter from the president in the annual report. If [the] letter is mildly pessimistic, to me that's a good sign. I like a point I once heard made by a corporate chief executive, that he was less interested in hearing good news from subordinates than bad news. The good news takes care of itself."
Lawrence A. Cunningham is a professor and director of the Quality Shareholders Initiative at George Washington University. Cunningham's books include Quality Shareholders; Dear Shareholder; and The Essays of Warren Buffett. Register for his upcoming free book talk hosted by the Museum of American Finance and Fordham University here. Cunningham owns stock in Berkshire Hathaway and is a shareholder, director and vice chairman of the board of Constellation Software.
Dividends and BuyBack were on hold due to uncertainty created by COVID
Upbeat forecast by consulting and outsourcing
services provider Accenture lifts Tech companies across board
Shares of information
technology majors, including Infosys, TCS, HCL
Tech, Wipro and Tech
Mahindra, traded with gains on BSE on December 18 2020 morning,
boosted by an upbeat forecast by consulting and outsourcing services provider
Accenture.
Accenture reported
strong revenue growth, order bookings and raised guidance, underscoring the
accelerated demand for technology transformation. AReuters report said the company has
estimated the revenue growth for the fiscal year 2021 between 4 percent and 6
percent, above its previous estimate of 2-5 percent.
Accenture's forecast is
considered a strong hint for the Indian IT companies. The positive forecast augurs
well for these companies.
Global brokerage firm
Credit Suisse said a pick up in Accenture's revenue growth and strong bookings
augured well for the demand environment.
"Infosys & HCL
Tech are our preferred picks in the sector. We like Infosys on its industry-leading
revenue growth and margin expansion potential. We are positive on HCL Tech due
to its attractive valuation," Credit Suisse said.
Accenture's forecast is considered a strong hint
for the Indian IT companies. The positive forecast augurs well for these
companies.
Brokerage firm Motilal
Oswal Financial Services sees Accenture's Q1FY21 earnings and management
commentary as a reiteration of the adaptability and resilience of its business
model.
"We continue to
form a positive stand on Indian IT, led by positive trends on higher technology
spending across global companies," Motilal Oswal said.
Prabhudas Lilladher said
Accenture maintained its view of strong growth recovery in H2 of high
single-digit with no impact of reimbursable travel costs.
"Accenture results
reinforce our view of (i) accelerated demand for cloud adoption (ii) rising
number of large transformation deals (iii) broad-based demand across all
industry verticals," Prabhudas Lilladher said.
After the run-up in the
last six months, the Indian IT sector valuation appears rich when compared to
its long-term average.
However, Prabhudas
Lilladher said the valuation had many aspects and it should be assessed on a
broader parameter.
"In our view,
valuations should not be looked at separately and should also factor in key
aspects such as (1) sector has entered into technology upcycle, (2) valuations
has a strong co-relation with sales and earnings growth, (3) prolonged
low-interest rate environment, (4) digital becoming mainstream and (5) strong order
book and deal pipeline," it said.
The valuations were
reasonable and it was bullish on the Indian IT sector, the brokerage said.
"Our preference
order in largecaps remains Infosys, HCL Tech and TCS and in Tier-2 Coforge,
Larsen & Toubro Infotech, Mindtree and Mphasis," said Prabhudas
Lilladher.
Taking a different view,
ICICI Securities said the Nifty IT may underperform in FY 22.
We see a high likelihood of Nifty IT
underperformance over 2021. Recent Infosys' commentary around reaching 'just'
pre-COVID growth in FY22 is a good starting point for the expectation
reset.-ICICI Securities
"We see a high
likelihood of Nifty IT underperformance over 2021. Recent Infosys' commentary
around reaching 'just' pre-COVID growth in FY22 (nearly 8-10 percent YoY, against
expectations of strong acceleration) is a good starting point for the
expectation reset," the brokerage said.
The current relative
valuations of Indian IT against global tech would present a more compelling
investment case in the latter, especially for FIIs, it said.
"We stay cautious
and selective on the IT sector, preferring stocks with scope for idiosyncratic
surprises and valuation comfort (Infosys, HCL Tech, Mphasis and
Mindtree)."
JB Chemicals stake sale news and finally acquisition of controlling stake by KKR
5thJuly2020
Shares of JB Chemicals and Pharmaceuticals Ltd were flat between October 2016 and October 2019. But in the past eight months, they have more than doubled. This has partly got to do with the news of a buyout by a private equity firm, which has been floating in the market for a while.
Besides, investor sentiment for pharmaceutical stocks has improved in the recent months. The upshot: shareholders of JB Chemicals are sitting on hefty gains already. News of the buyout by KKR and its open offer at ₹745 per share may not seem too exciting at first, given that the shares currently trade at ₹718 on the bourses.
However, against the backdrop of about 116% gains in the past eight months, shareholders seem to be getting a decent deal, prima facie. After all, the company’s promoters, too, are selling a majority of their stakes at this price.
But some analysts said that patient investors can sit out the open offer by KKR at ₹745 and wait for better returns later.
“The purchase price represents price-earnings of 22 times on trailing earnings of ₹34. This, in our view, does not represent any premium for the franchise that has improved significantly in the recent past," said Kunal Damesha, an analyst with Systematix Securities.
JB Chemicals has been growing at a decent clip over the past three years. It clocked growth in April and May of about 12% in its top brands as against a 10% decline in the Indian Pharma Market, owing to decent brands in the chronic segment.Growth in the acute segment was slow, though. In addition, JB Chemicals’ cash flow generation has improved, while return on equity jumped from 13% last year to 20% in FY20.
“Growth will moderate in FY21 owing to one-off covid-related disruptions. However, we still expect JB Chemicals’ India business to grow in double digits in FY21, based on trends seen in April and May 2020," said IIFL Securities analysts in a recent note to clients.
Besides, note that KKR is looking to acquire a 54% stake in the company, which would give it a controlling stake in JB Chemicals.
If it manages to grow the franchise, investors could well expect the decent returns to continue. And, the founders are not entirely selling out, and will continue to have some skin in the game.
For investors with patience and willingness to bank on KKR’s abilities, there may still be some juice left in the stock.
Analysts said given the lack of a decent premium to the current market price, investor participation in the open offer may not be significant in any case.
STOPLOSS
Momentum investing
Market
goes through motions during price
discovery at which time you can find trading opportunity to long or short and
expect exit for both sides. If price discovery is a given due to demand higher
than supply or vice versa, then it goes one way and only side of traders make money
A
sudden move starts 2pm or 2.30 pm
or 3 pm. Due to short covering etc, the moves tend to be sharp.. One 50 points
move can automatically lead to another 50 points. Or it could hit a resistance
and reverse back. Whether the last hour moves have correlation to rollover
trend like 80% rollover completed by 2pm or only 70% completed...
What are the stocks which are giving sudden 100
point move in last one hour. In banknifty it will be hdfc or sbi etc. In nifty
what are they. It can be auto, technology,metals or some such sector
Expiry trade has the least respect for technicals
or fundamentals. Expiry can always happen 100 points away from estimated level.
Things go out of hand quickly during expiry. There is some range and range
breakout. More and more weekly expiry and having seen some previous history of
market trend puts you into false sub consciousness status. Lazy and confused
mind goes by subconscious previous knowledge.
Safer
possibilities than Expiry Trade
Buy and hold. Because stocks will finally go up.
Higher capital Higher time
Sell OTM options: Because there are option buyers
who buy cheap options to gamble or test their luck which happens rarely.
Higher capital Higher probability medium returns.
Buy options : on the trending side. Simple but less
appealing to the intelligent ego and if you believe somebody is just managing
the show for some time which can't hold long and will eventually reverse
Buy options : reverse side. Hope of reversal and
finding mean average. Relying on the fact Statistics tend to find a mean
and not remain in either of the extremes over a period of time in general. But
premium decay may kill you. And that much awaited reversal may happen after one
more step.
Futures buy or sell and roll over : possible in volatile
market. Fail only if market makes one sided moves only.
9.20 is better than 9.15 :
Taking position at 9.15 is blind bet based on some analysis, but taking bet at
9.20 is better as you can see confirmation and that trend will continue atleast
till 11 after which it may progress or reverse based on Hong Kong, UK etc
markets. This happens 90% of the time. For the balance 10% where the 9.20
trend is reversed suddenly stop-loss will protect you.
Some Notes
Oscillation range sometimes telling you some
message but sometimes it is just a diversion
Often times technical and fundamental run contra to
each other.When market open down fundamental analysis may find it lucrative to
buy but technical analysis will treat it as sell case and buying will come only
after it showed support at some level.
When the recovery comes, does it come from short
covering of beaten down stocks or new sectoral rotation.The leading stocks in
such scenario are supposed to have some strength.
You should be able to take up 10 punts between
index and stock specifics and futures and options , option selling and
buying...
You should be able to keep tight when things
are not clear not compulsive
Diff between invitation vs warning for exit
Dont average...dont see fall as a chance to buy more or desperately average more. A fall may be precursor to bigger fall unless support levels are hit or its just a swing of up and down . There is no way to differentiate whwther a fall is just a swing or precursor for bigger fall. Or may be there are ways...
Range bound of the expected range
You should be fearful about levels getting broken and not confident about levels getting protected. If levels get protected it will be post facto called as range bound and if levels breached it will be out of bounds on which a trade gamble cannot be picked up because nothing can be done in the short term in that last one hour when it breaks levels. Knowledge of present news and past history gives false impression that you are equipped enough to predict levels. This coupled with habit building that happened between 12pm and 2pm in which a narrow range seemed like possible and worked well- will kill you. Knowledge based confidence, habit based on recently seen range and desperate hope making you brazen to keep positions naked.. Cocktail of these three will kill. And did so around 50 times in last 60 months.
Volatility means breaking support and resistance levels continously without any respect for levels. Which means either buyers or sellers have field day. Range bound is a darling of chart analyst where the levels are respected as if market is under control of algo traders which involves both buyers sellers following the range.
Expiry trades involving option buying are never worthy of full capital given the fast premium decay after 2pm.they are only worthy of option selling.
Value transfer in options trade When you trading expiry.. You will not do stop-loss and are pushed to a hope that there will a attempt to recovery once again just like we saw happening twice in last 2 hours. But if that does not happens you will be zero.
Options is a zero sum game. There is no value creation. Value is moved from one person whose prediction is wrong to another person. During rally you bet that rally will end at x level whereas other person bets it as x plus 100.one of you will be right and get profit. During fall you bet on reversal at some support whereas that support doesn't stick you loose money to the person who predicted that the fall has more depth.
On a expiry day you may do fine till 2pm to do predict the range which index is trying to make but after appearing to be oscillating both sides, suddenly it will get momentum on one side and you lose it.
Never have a psychological target figure like 16500 for the expiry. Sometimes expiry happens on target range but often it is out of bounds. Be braced for one sided move only after 2 pm. don't try to pick from minor oscillations arising on the side line while the main track is going to be major move on one of the sides.
Be aware that on expiry day there will be attempt to find a base btw 12 and 2 in which there will opportunities for picking few points on either side but after that it's toooo risky to predict the one side move it is going to take or the premium decay it will result. Be frightful of premium decay and not try to brazen with hope of trend reversal.
Market is a swinger for sure but with unknown swings. Swings are the opportunity and the unknown velocity is the risk. While chasing the opportunity risk is intervened in the same. Undisciplined mind cannot handle the seperation of opportunity and risk.


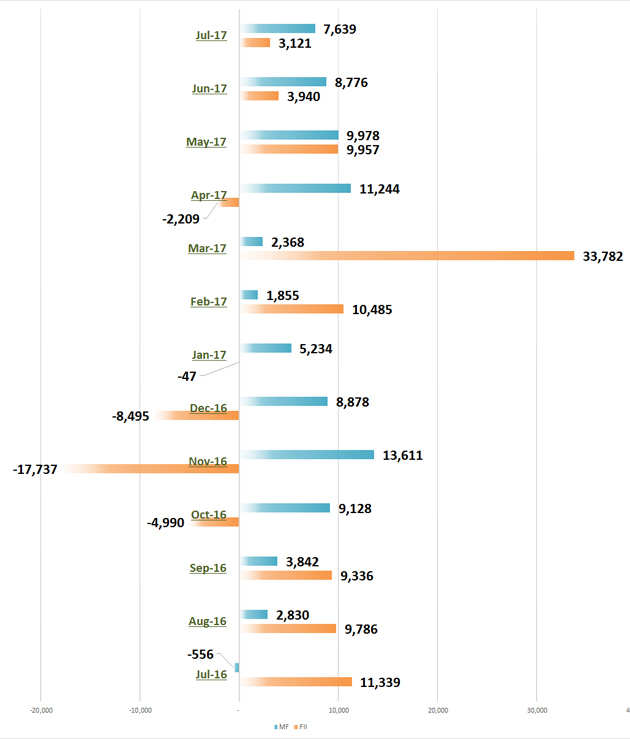


 Exploration costs (about 5%) - finding the oil and confirming it's viable. Simply setting up a deep water exploration well can cost $100-200m, and only one in four is successful [3].
 All of this is just global averages though, and reality is more complex.
 RIDE THE TIDE
 India Fund Flow vs Other EMs


